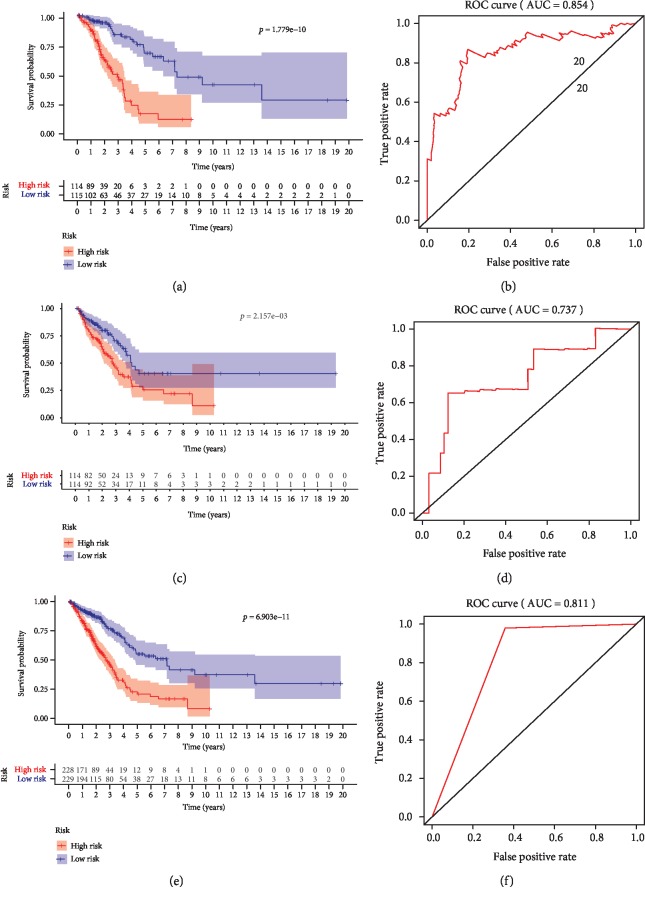
Figure 4.
Kaplan-Meier survival curves and ROC curves to evaluate prognostic models based on the 13-lncRNA signature. (a) Kaplan-Meier survival curves for lung adenocarcinoma patients between the low- and high-risk groups in the training cohort. (b) ROC curves showing the predictive ability of the signature for 5-year OS. (c) Kaplan-Meier survival curves for lung adenocarcinoma patients between the low- and high-risk groups in the validation cohort. (d) ROC curves showing the predictive ability of the signature for 5-year OS. (e) Kaplan-Meier survival curves for lung adenocarcinoma patients between the low- and high-risk groups in the total group. (f) ROC curves showing the predictive ability of the signature for 5-year OS.

