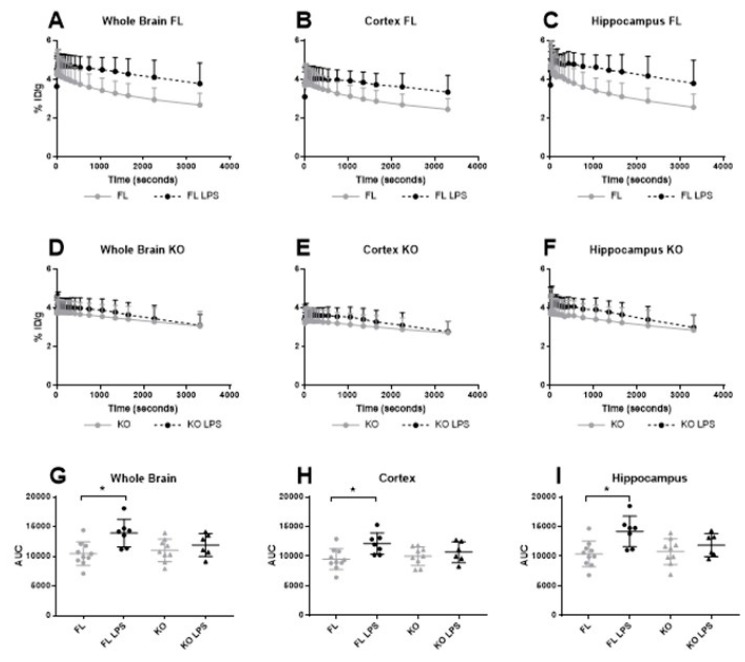
Figure 2.
Time activity curve and the area under curve (AUC) of [18F]FEPPA in the whole brain (A,D,G), the cortex (B,E,H) and in the hippocampus (C,F,I) in floxed and deleted Cx43 mice with or without LPS injection 24 h before imaging. [18F]FEPPA Time Activity Curves (TAC) (in %Injected Dose/g) and the AUC (%ID×g−1 × s−1) before and after LPS injection in FL and KO Cx43 mice (n = 6–10). (A,D,G) [18F]FEPPA in the whole brain before and after LPS injection in FL and KO mice. (B,E,G) [18F]FEPPA in the cortex before and after LPS injection in FL and KO mice. (C,F,I) [18F]FEPPA in the hippocampus before and after LPS injection in FL and KO mice. A one-way ANOVA test has been used for comparison between groups. * p < 0.05.

