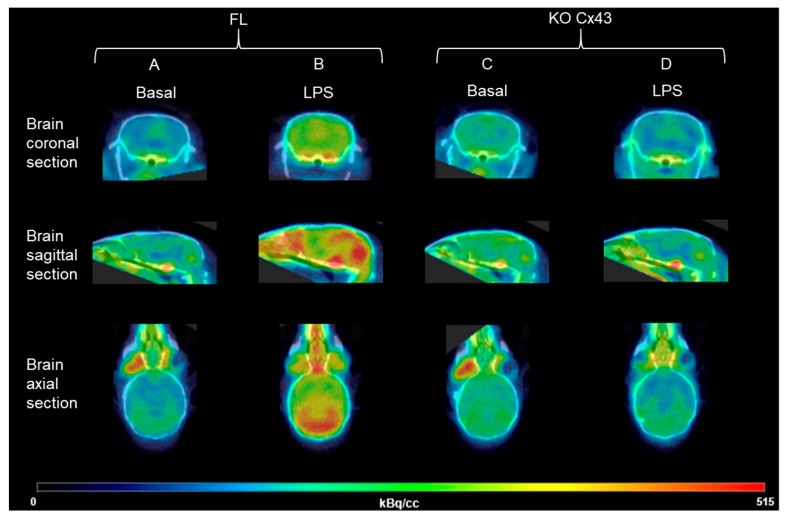
Figure 3.
Representative microPET/CT imaging of brain inflammation with the TSPO radioligand [18F]FEPPA before and after the LPS injection in FL or KO Cx43 mice. The signal sum of all the frames in kBq/cc; (A) KO Cx43 mouse before the LPS injection, (B) KO Cx43 mouse after the LPS injection, (C) FL mouse before the LPS injection, (D) FL mouse after the LPS injection

