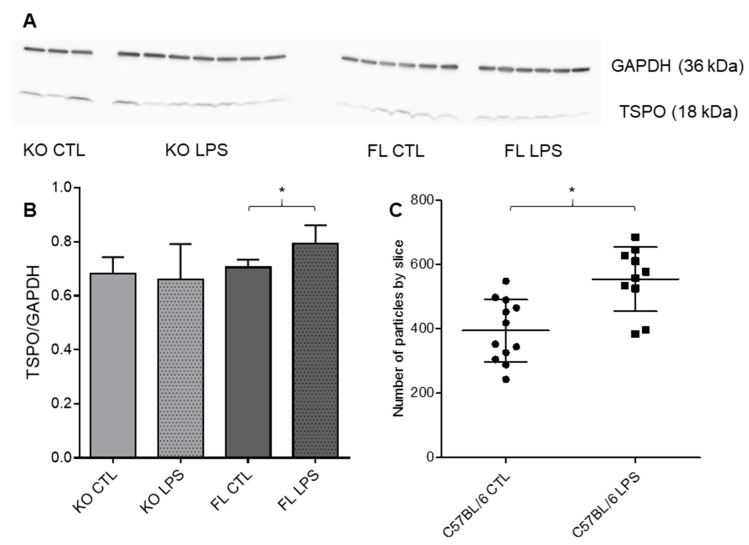
Figure 5.
Effect of LPS injection on brain cortex TSPO expression (A) Blot of TSPO and GAPDH in the cortex of FL and KO Cx43 mice with or without the LPS injection. (B) Western blot analysis by mean comparison of TSPO/GAPDH ratio, significant difference between FL with or without LPS (p = 0.0276, t-test, n = 3–7). (C) FISH analysis by mean comparison of the number of particles in each cortex slice corresponding to a TSPO signal (p = 0.0011, t-test, n = 10–12). * p < 0.05.

