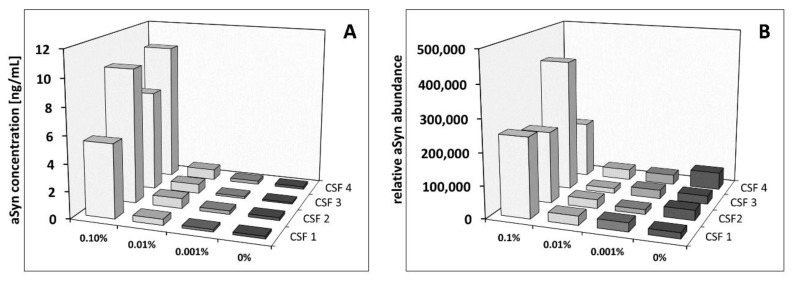
Figure 7.
Influence of blood contamination on the quantification of aSyn using ELISA and label-free-based MS using artificially blood-contaminated CSF. Comparative quantification of aSyn in non- and artificially blood-contaminated CSF samples in the range of 0.001% to 0.1% from four different individuals (CSF 1 to CSF 4) was performed with ELISA (A) and MS-based analysis (B). Shown are in (A) the aSyn concentrations in ng/mL and in (B) the relative abundance obtained with the data analysis utilizing the MS software Progenesis QI.

