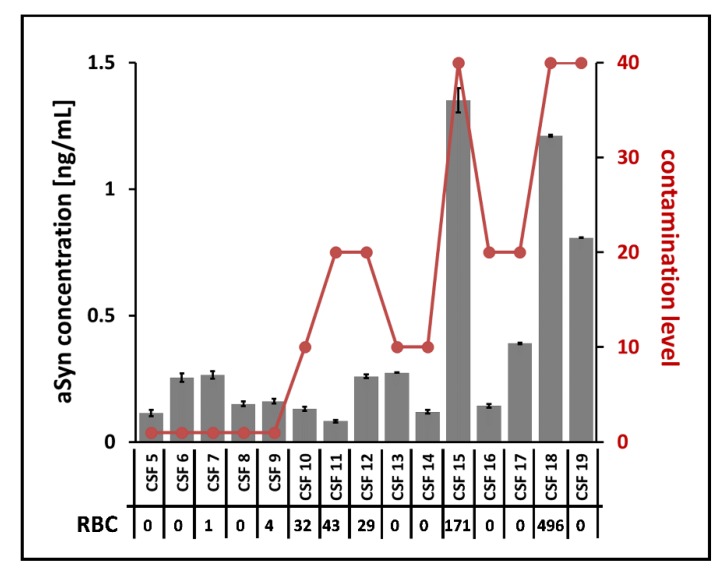
Figure 8.
Correlation of ELISA aSyn quantification, contamination levels, and RBC counts from clinical samples. Shown are aSyn concentrations from 15 clinical samples (CSF 5 to CSF 19) obtained by ELISA analysis in relation to the detected contamination levels (marked in red) based on the Combur10-Test® and to the RBC count from routine laboratory diagnostics. ELISA measurements were performed in duplicate. ASyn was quantified in all samples.

