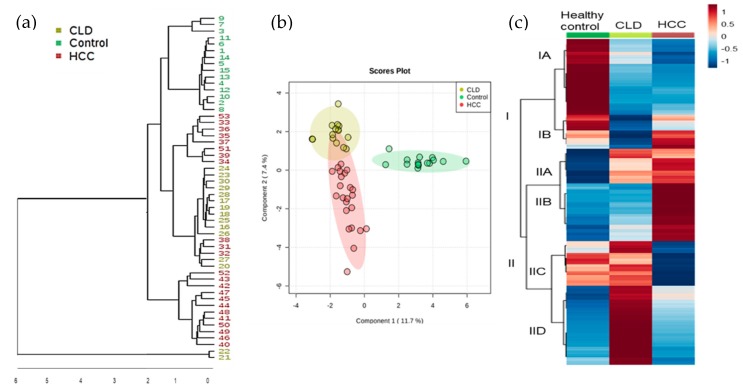
Figure 1.
Multivariate clustering of blood-based metabolomics data using GC-TOF mass spectrometry. (a) Unsupervised hierarchical clustering of all 730 detected metabolites in the studied groups HCC, Chronic Liver Disease (CLD), and healthy control. (b) Supervised sparse partial least squares-discriminant analysis of all 730 metabolites to better distinguish metabotypes of study groups. (c) Clustering of 510 significant metabolites (Mann–Whitney U test p < 0.05 and qFDR < 0.1) across the three test groups, range-scaled from increased (+1, red) to decreased (−1, blue).

