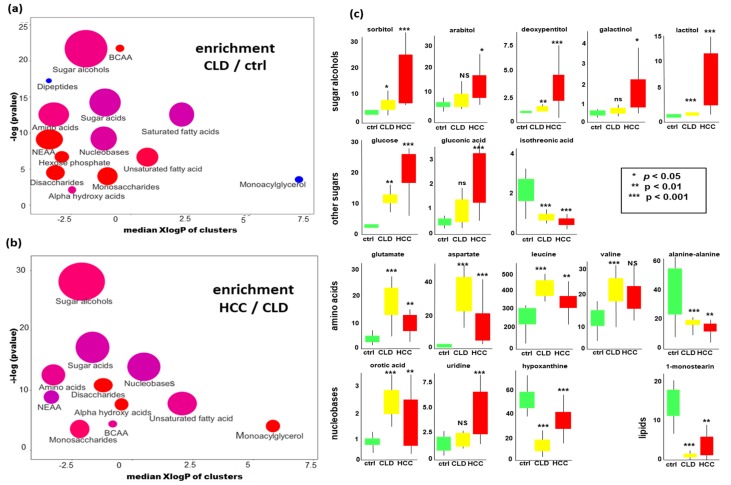
Figure 2.
Significant differences in blood metabolites in HCC versus CLD patients and healthy controls. (a) Chemical set enrichment statistics (ChemRICH) comparing CLD to healthy control subjects. (b) ChemRICH statistics comparing HCC to CLD subjects. Colors of chemical sets: red = increased, blue = decreased, purple = sets with compounds decreased and increased. Ball sizes represent the number of compounds per metabolic set. X-axes represent median lipophilicity (XlogP) of the metabolic clusters. (c) Univariate statistics of selected metabolites showing significant differences. Units of all y-axes: normalized peak intensities in 1000 ion counts/spectrum for each quantification ion (Supplementary S1).

