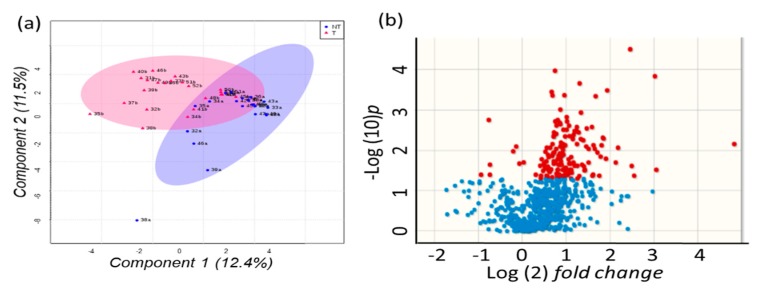
Figure 3.
Multivariate analysis of 730 peaks detected by untargeted GC-TOF MS metabolomics analysis of paired HCC tumors versus non-malignant liver tissues. (a) sparse Projections to Latent Structures Discriminant Analysis (sPLS-DA). Blue: non-malignant tissues, red: tumor biopsies. Percentages give the total explained variance for vectors 1 and 2. (b) Volcano plot for differential regulation of metabolites. Blue: not significant at raw p < 0.05, red: significant changes at p < 0.05.

