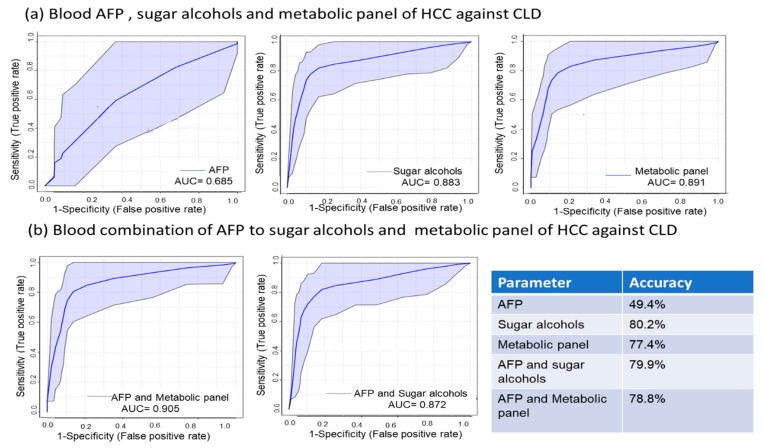
Figure 6.
Receiver operating characteristic (ROC) curve analysis of a 6-metabolite panel of discriminating metabolites, a panel of blood sugar alcohols, and AFP to differentiate HCC from chronic liver disease (CLD). (a) ROC curve of AFP, 6-metabolite panel, and sugar alcohols to differentiate HCC from CLD and associated accuracy of each comparison. (b) ROC curve of combined AFP with the 6-metabolite panel, and sugar alcohols to differentiate HCC from CLD and associated accuracy of each comparison.

