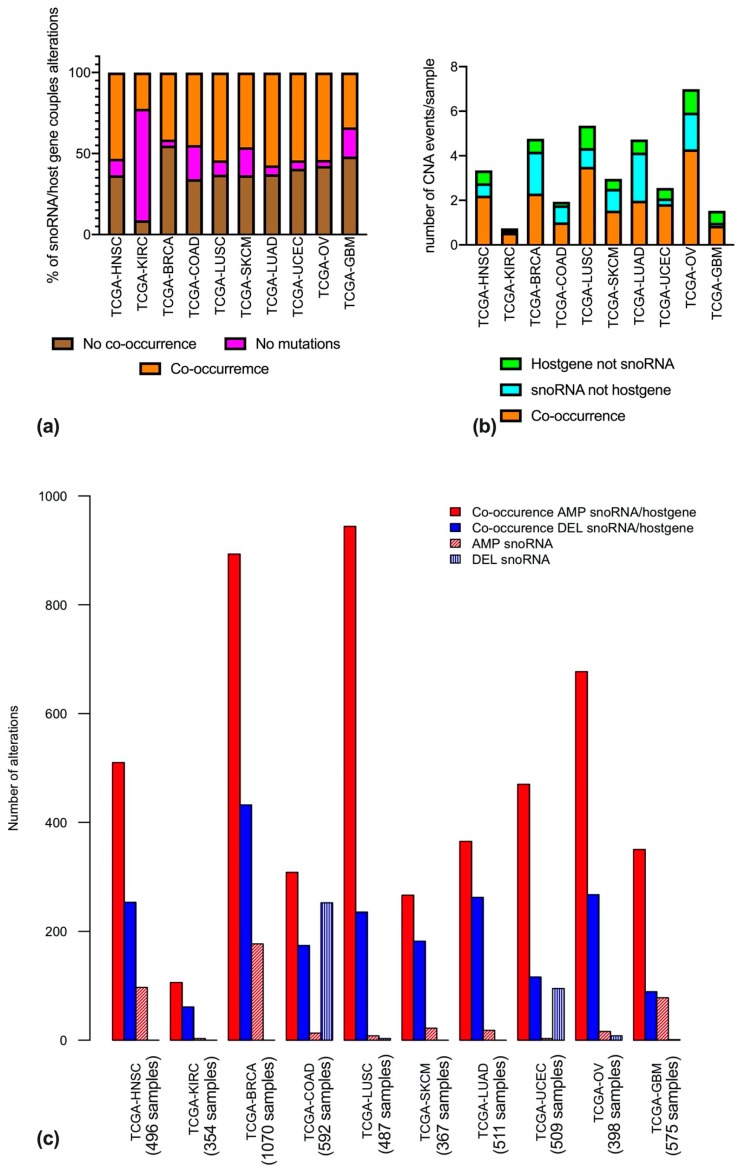
Figure 2.
Co-occurrence of CNA in snoRNAs and host genes across different cancer types. (a) Percentage of co-occurrence of CNA in snoRNAs and host genes. Orange bars represent co-occurring mutations; brown bars represent mutations that do not co-occur, and purple bars represent absence of mutations. (b) Number of CNA events, normalized per sample, and represented with different colors in case of co-occurrence (orange), alteration in snoRNA but not in the host gene (light blue) or alteration in the host gene but not in the snoRNA (green). (c) Number of mutational events, split into amplification (red) and deletion (blue), and further into CNAs only involving snoRNAs (textured bars) and CNAs involving both snoRNA and host gene (filled bars).

