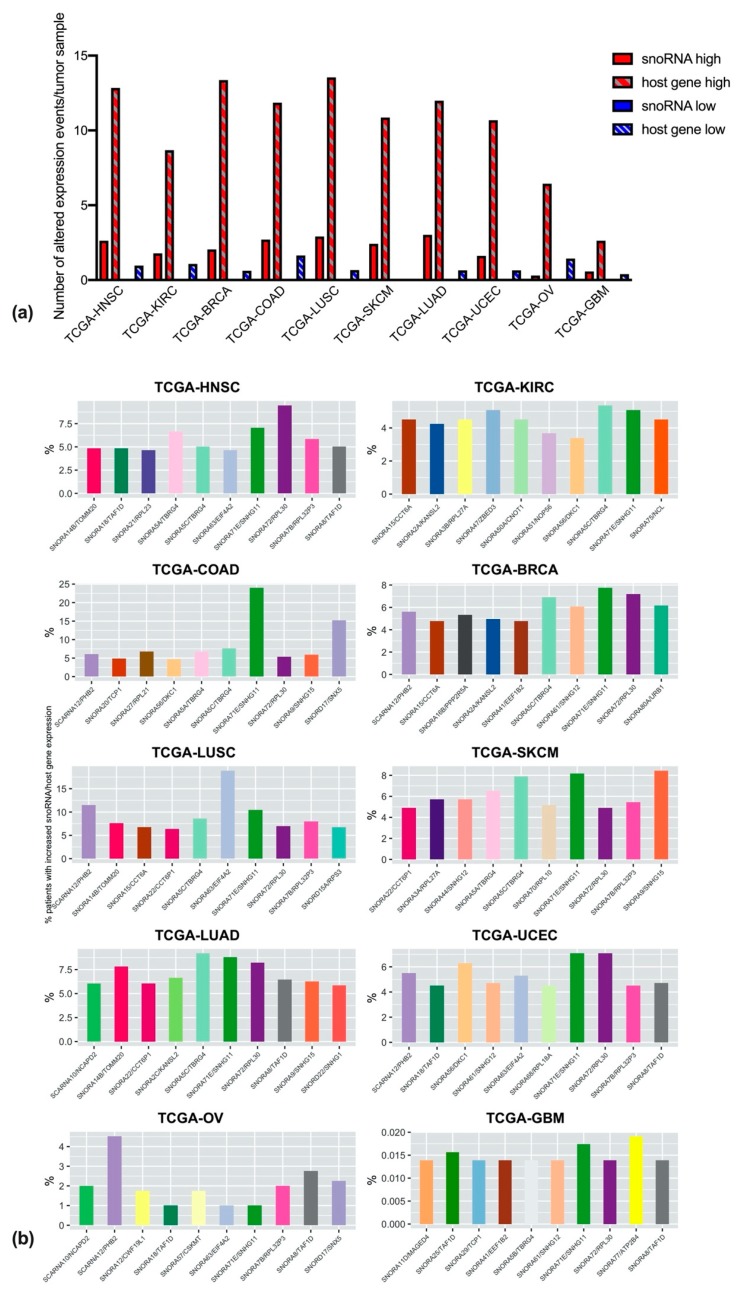
Figure 4.
Alterations in gene expression for snoRNAs and host genes. (a) Number of expression alteration events, normalized per sample, and represented with different colors in case of higher expression (red), lower expression (blue), and further split into expression alterations only involving snoRNAs (filled bars) or involving host genes (textured bars). (b) Top snoRNA/host gene couples undergoing expression alterations in the ten different tumor types. For easier interpretation, couples recurring in different tumor types have been assigned the same bar colors, and colors are matched to those assigned in Figure 3.

