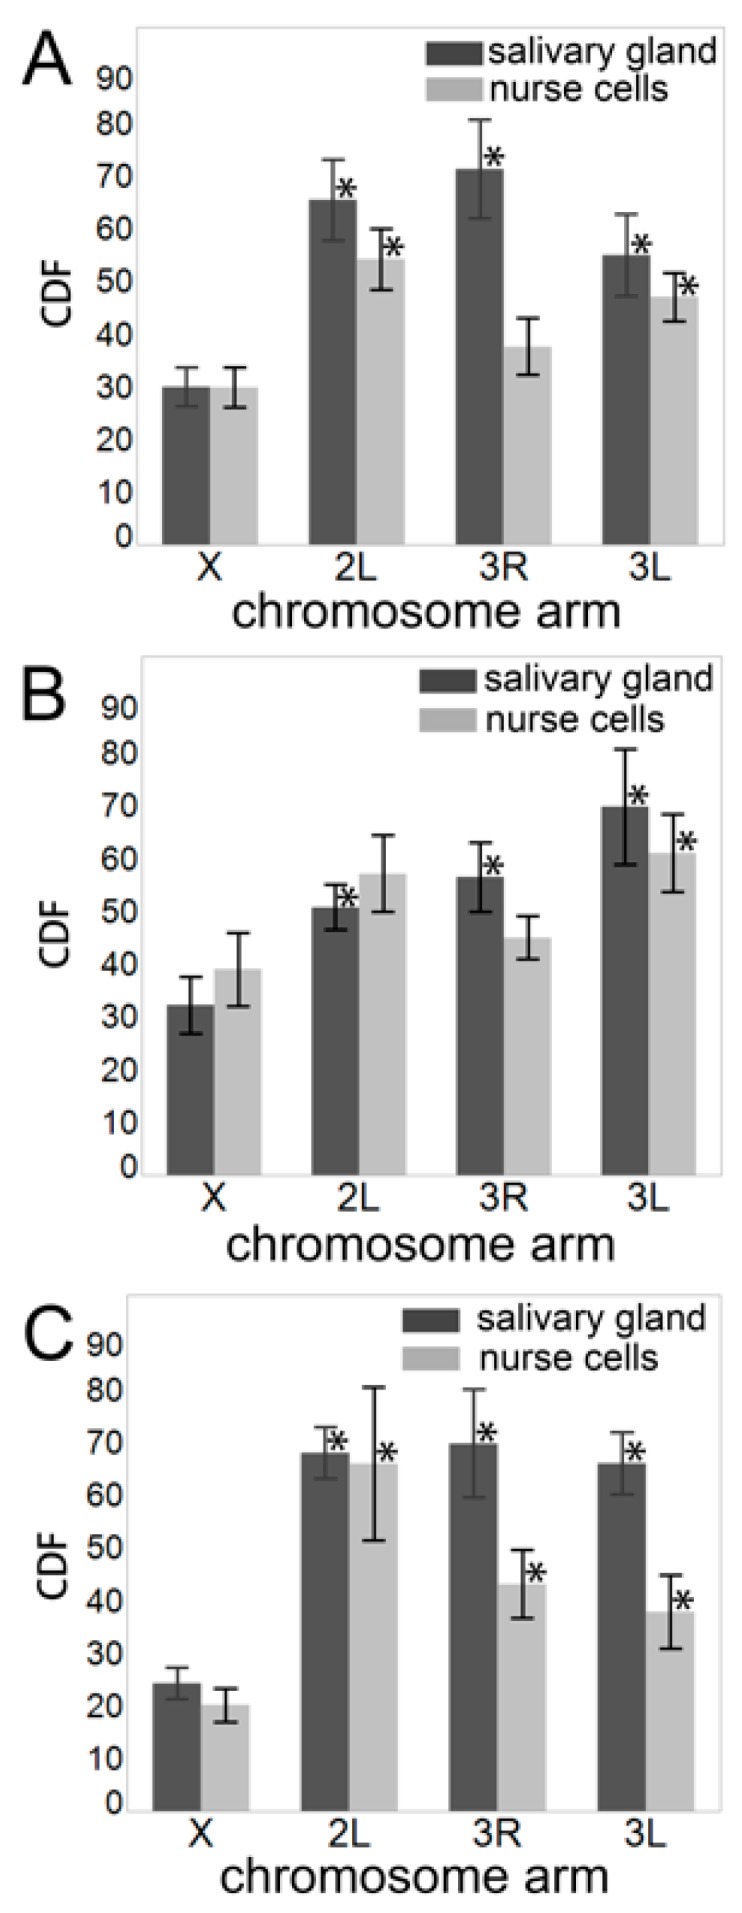
Figure 4.

The chromosome decompaction factor (CDF) in salivary gland cells (dark gray bars) and ovarian nurse cells (light gray bars). (A) An. coluzzii. (B) An. gambiae. (C) An. merus. Asterisks above autosomal bars indicate significant differences in CDF between the X chromosome and the autosomal arms, with * p-value < 0.05.
