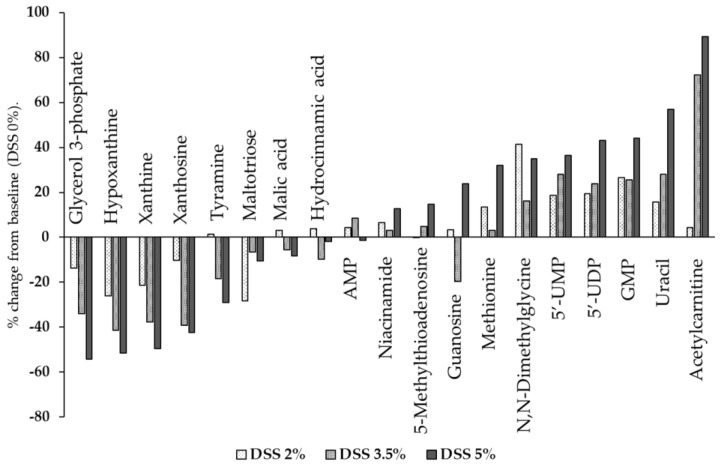
Figure 7.
The percent change in liver metabolite levels in the DSS-treated mouse liver relative to the levels in normal liver. % Change = ([DSS-treated liver]–[control liver])/[control liver] × 100). The concentrations of metabolites were calculated based on the integration of peak areas using SCIEX peak view. AMP, adenosine monophosphate; 5′-UMP, uridine 5′-monophosphate; 5′-UDP, uridine 5′-diphosphate; GMP, guanosine monophosphate.

