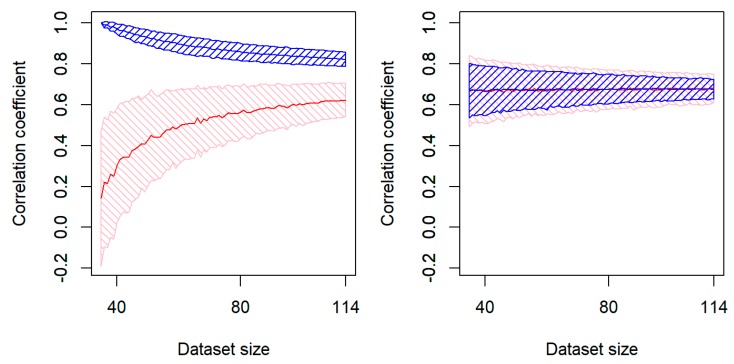
Figure 4.
Learning curves for the model having 19 adjustable parameters based on the amino acid occurrences in proteins having different folding times (left). For sub-datasets of different sizes (x-axis) sampled randomly from the general experimental dataset for 114 proteins, the 60% and 40% of the sub-dataset were used for training and testing the model, respectively. The shaded area depicts the most frequently observed values of the correlation coefficient (within one standard deviation from the average value): Blue and red for the training and testing sets, respectively (left). The same for the above described (see Equation (2) and Figure 2 and Figure 3) model, where t = τ × exp[L2/3], that has no adjustable parameters (right). Adapted from [99] with minor modifications.

