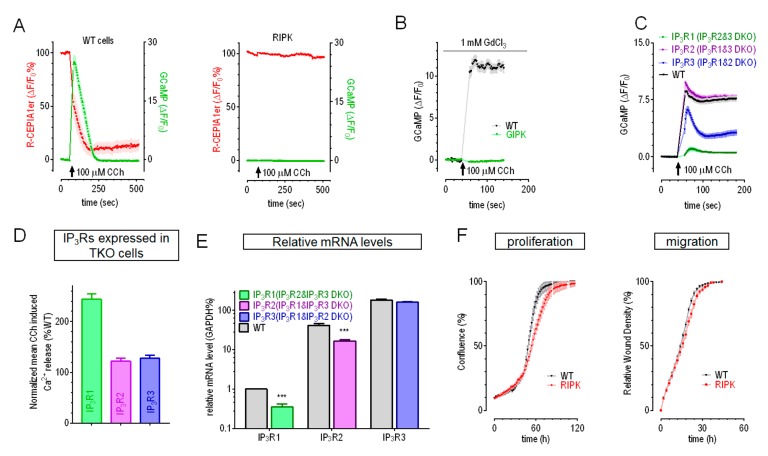
Figure 1.
Characterization of HEK IP3Rs-TKO and IP3Rs-DKO cells. (A–C) Typical carbachol (CCh, 100 μM)-induced Ca2+ responses from ER in HEK IP3Rs-TKO and IP3Rs-DKO cells. (A) CCh-induced Ca2+ changes as shown with transiently expressed cytoplasmic Ca2+ indicator GCaMP6m (Green) or stably expressed ER Ca2+ indicator R-CEPIA1er (Red). Left panel, responses of WT HEK cell stabling expressing R-CEPIA1er; right panel, R-CEPIA1er stable cells with IP3Rs-TKO (RIPK). (B) Representative CCh-induced responses in HEK GCaMP6m stable cells without (WT, black trace) or with IP3Rs-TKO (GIPK, green trace). (C) Typical CCh-induced Ca2+ releases in HEK GCaMP6m WT cells or those with IP3Rs-DKO. 1 mM GdCl3 was included in bath solution to block Ca2+ movements across PM in B) and C) (n = 3). (D) Statistics showing relative sizes of mean CCh-induced Ca2+ releases in RIPK or GIPK cells transiently expressing IP3Rs (see Figure S1A,B for typical curves). (E) Relative mRNA levels of three types of IP3Rs in HEK cells and IP3Rs-DKO. mRNA levels were first normalized against corresponding GAPDH levels, then normalized against corresponding IP3R1 levels of WT cells. Expression levels of IP3R1 in WT cells were set as 1 (mean ± SEM, *** P < 0.0001, Student’s t-test). (F) Typical proliferation (left panel) and migration (right panel) curves of RIPK and WT cells.

