Figure 2.
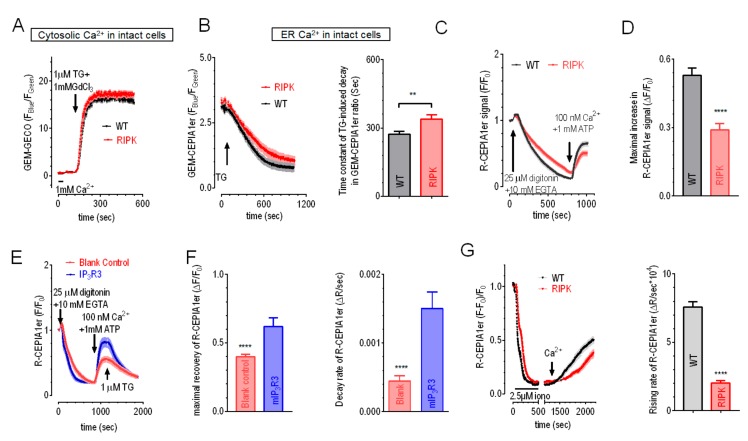
Effects of IP3Rs-TKO on ER Ca2+ dynamics and corresponding changes induced by overexpression of mIP3R3. (A) Typical traces showing TG (1 μM)-induced Ca2+ releases in HEK WT (black trace) or RIPK (red trace) cells transiently expressing GEM-GECO. 1 mM GdCl3 were included in external solution to block Ca2+ movement across PM. No differences in responses between WT and RIPK cells were seen (n = 2). (B) TG (1 μM)-induced responses indicated with transiently expressed GEM-CEPIA1er. Left, typical traces; right, statistics (n = 3, ** P < 0.01, Student’s t-test). (C) Typical changes in R-CEPIA1er signals in response to PM permeabilization (25 μM digitonin), passive ER store depletion (10 mM EGTA), and SERCA-mediated ER Ca2+ refilling in the presence of ATP and Ca2+. (D) Statistics of traces in C) showing maximal increases in R-CEPIA1er signals after the addition of Ca2+ and ATP (n = 4, *** P < 0.0001, Student’s t-test). (E) Representative R-CEPIA1er traces of RIPK cells transfected either with empty vector or BFP-P2A-mIP3R3. Experimental procedures were similar to those in (C) in the first steps. In the end, 1 μM TG was added into bath solution to examine ER Ca2+ leakage. (F) Statistics of (E). Left, maximal increases in R-CEPIA1er signals after addition of ATP and Ca2+; right, initial decay rate of R-CEPIA1er signals after TG. (G) ER Ca2+ refilling indicated by R-CEPIA1er signals in intact R-CEPIA1er or RIPK cells. ER Ca2+ stores were depleted with 8-min bath with 2.5μM ionomycin. After another 10-min in 0Ca2+ solution, Ca2+ were added externally to allow SOCE and corresponding ER Ca2+ refilling. 300μM Ca2+ was used here to enlarge possible differences in SOCE amplitudes between two types of cells. Left, typical traces; right, statistics (n = 3, *** P < 0.0001, Student’s t-test).

