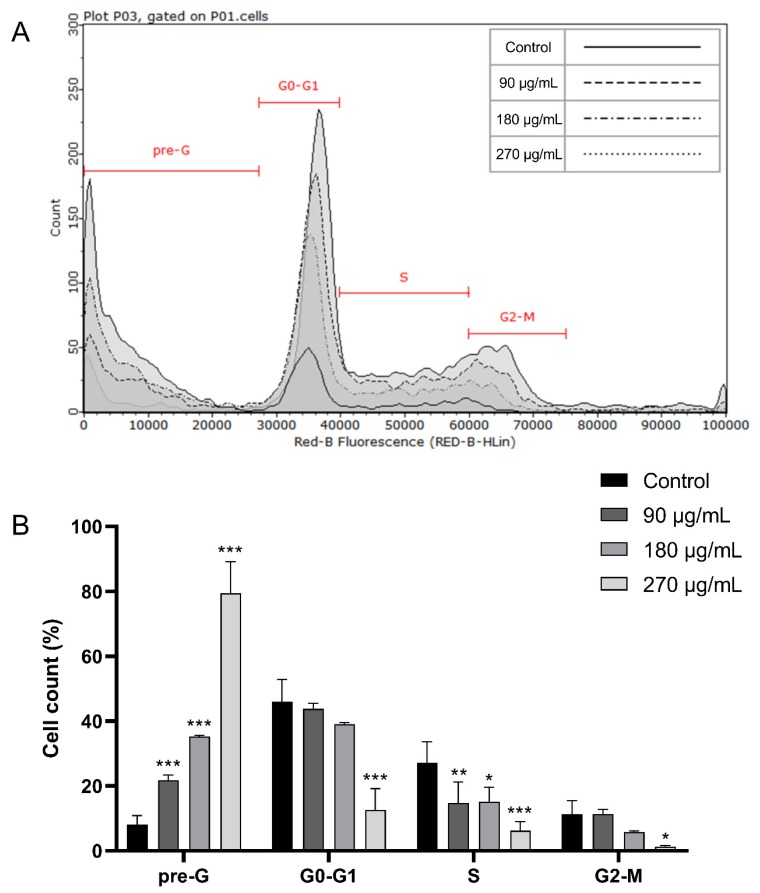
Figure 2.
Cell cycle analysis of Monomac-1 treated with MMLE for 24 h (A). The percentage of the cells in different phases of cell cycle was determined by C Flow software (B) A significant increase in the pre-G and a decrease in G0/G1, S, and G2/M in a dose-dependent manner was obtained and indicated an increase in DNA fragmentation in Monomac-1 cells upon MMLE treatment.

