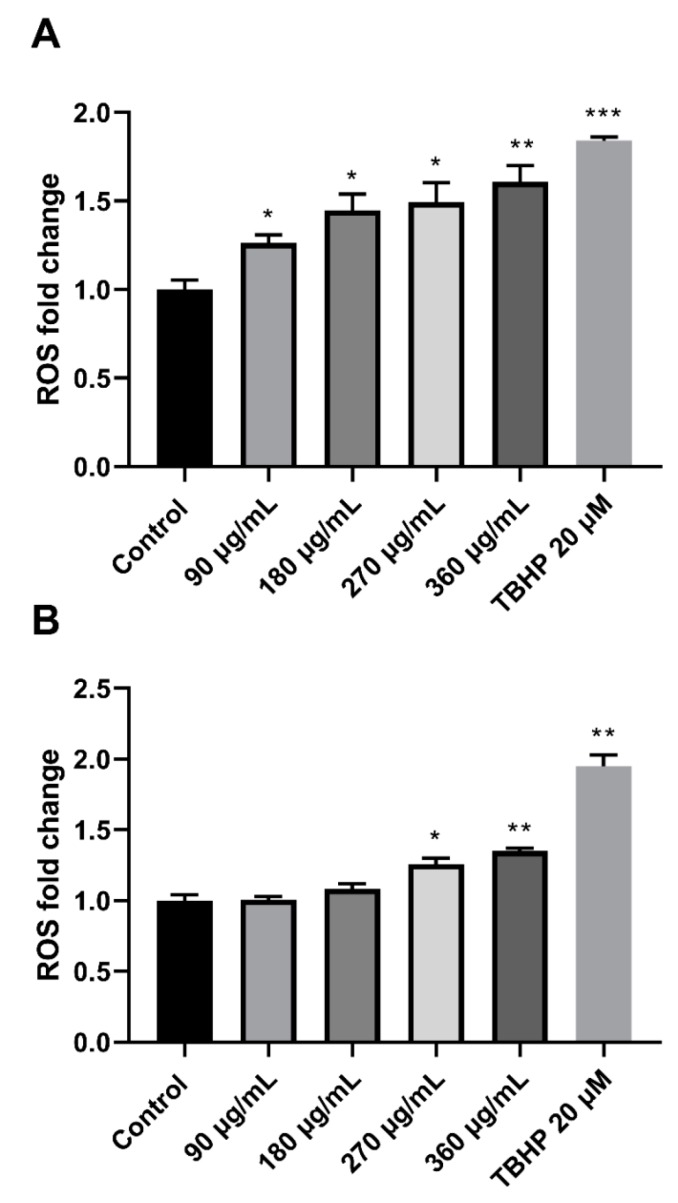
Figure 6.
Fold change of ROS in Monomac-1 (A) and KG-1 cells (B) treated with increasing concentrations of MMLE and a positive control treated with 20 μM of TBHP. ROS levels increased significantly with increasing concentration of MMLE for both Monomac-1 (A) and KG-1 cells (B). Significance relative to the negative control was reported with * indicating a p-value: 0.01 < p < 0.05, ** indicating a p-value: 0.001 < p < 0.01, and *** indicating a p-value: 0.0001 < p < 0.001.

