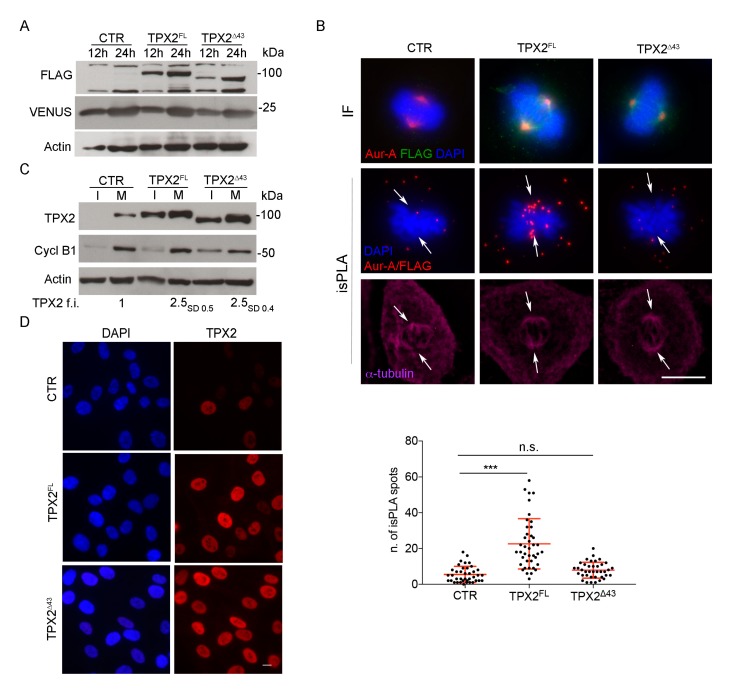
Figure 1.
Generation of hTERT RPE-1 stable cell lines overexpressing TPX2 full length (FL) or Δ43. (A) Western blotting (WB) analysis shows exogenous TPX2 (FLAG-tagged) in the indicated cell lines, after 12 and 24 h of dox induction. Levels of the fluorescent VENUS protein are also shown; actin is used as loading control. (B) Upper immunofluorescence (IF) panels show the localisation of Aurora-A and FLAG-tagged proteins in mitosis in the indicated cell lines (the green signal comes from anti-FLAG staining, while VENUS fluorescence was lost due to methanol fixation); in situ proximity ligation assay (isPLA) signals corresponding to the FLAG/Aurora-A interaction are shown in the panels below. Arrows indicate the position of spindle poles, as assessed by α-tubulin staining. Quantification of the number of isPLA spots within the spindle area under the different conditions are also shown (measures from at least 40 mitoses from three independent experiments; standard deviations (s.d.) are shown; *** p < 0.0001, n.s. (not significant) p ≥ 0.05, one-way ANOVA, Tukey’s multiple comparisions test. (C) Total levels of TPX2 in the indicated cell lines in extracts from interphasic (I) and mitotic (M) cells, 12 h after induction with dox; cyclin B1 is used as a cell cycle control, actin as a loading control. Average fold increase (f.i.) of TPX2 levels in mitotic extracts is shown; subscripts indicate s.d. Molecular weights are indicated on the right side of the WB panels (A,C). (D) IF panels show interphase localisation and increased level of total TPX2 in the indicated cell lines after 12 h of dox induction. Scale bars: 10 μm.

