Figure 6.
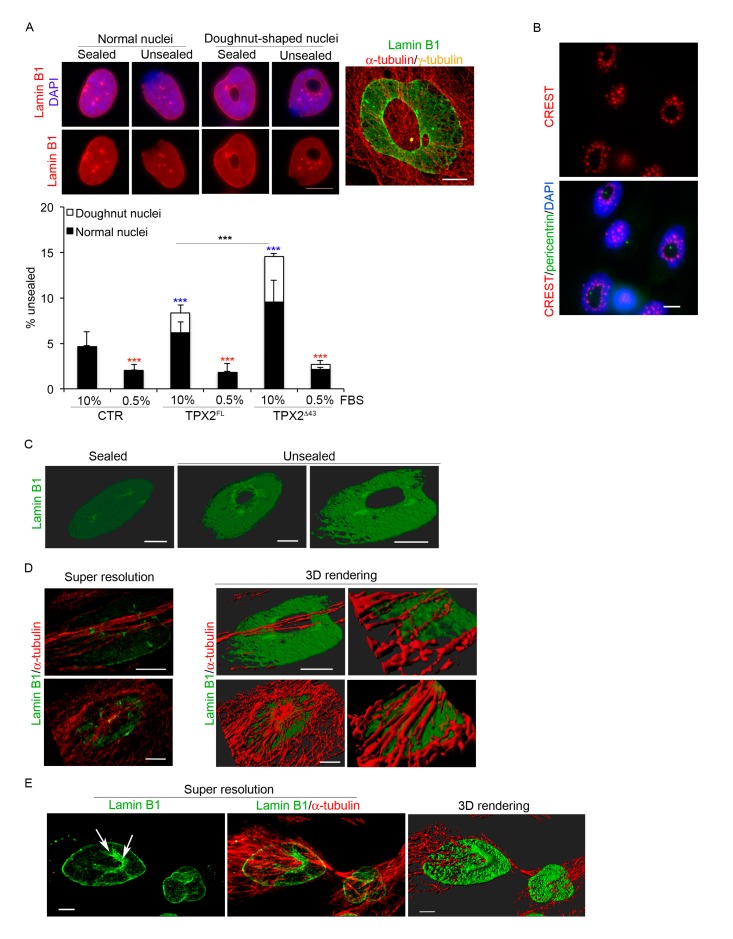
TPX2 overexpression interferes with lamin B1 organisation at the end of mitosis. (A) Overexpressing cells show a defective lamin B1 rim in normal and doughnut-shaped nuclei. The merged IF panel on the right is a super-resolved image exemplifying the defect. A total of 1500 cells were considered from three independent experiments for each cell line; s.d. are shown; *** p < 0.0001, chi-square (and Fisher’s exact) test. Blue asterisks refer to the difference from the control cell line, red ones to the difference, within each cell line, of serum starved cells (0.5% FBS) from control conditions (10% FBS). The statistical difference between TPX2FL and TPX2Δ43 is also indicated. (B) Kinetochores (CREST, in red) organisation in doughnut-shaped nuclei is shown. The green signal comes from pericentrin staining, while VENUS fluorescence was lost due to methanol fixation. (C) Examples of 3D rendering of cell nuclei displaying sealed or unsealed lamin B1. (D) Examples of doughnut-shaped nuclei: left panels are volume views of super-resolved images, central ones are 3D rendering views; from the latter, enlargements of specific ROIs (Regions of Interest) are shown in right panels. (E) Volume view of a telophase cell with a doughnut-shaped nuclei forming, showing lamin B1 staining (left panel), merged with the α-tubulin signal (central panel). 3D rendering is shown on the right. Scale bars: 10 μm for widefield images and 5 μm for super-resolved images.

