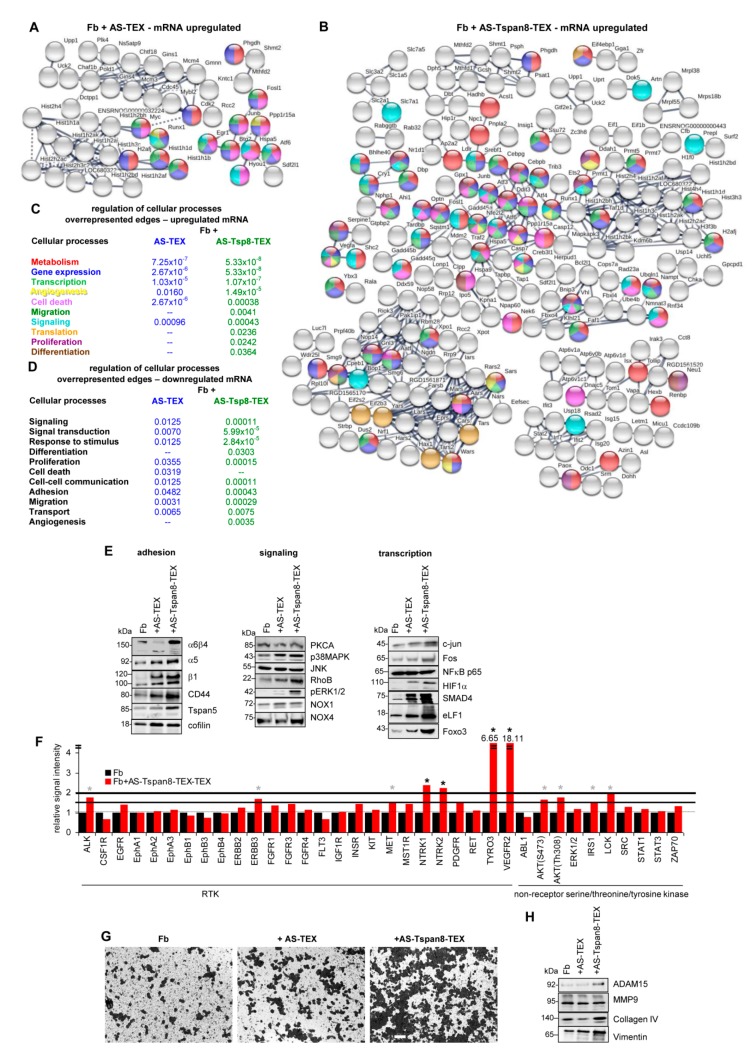
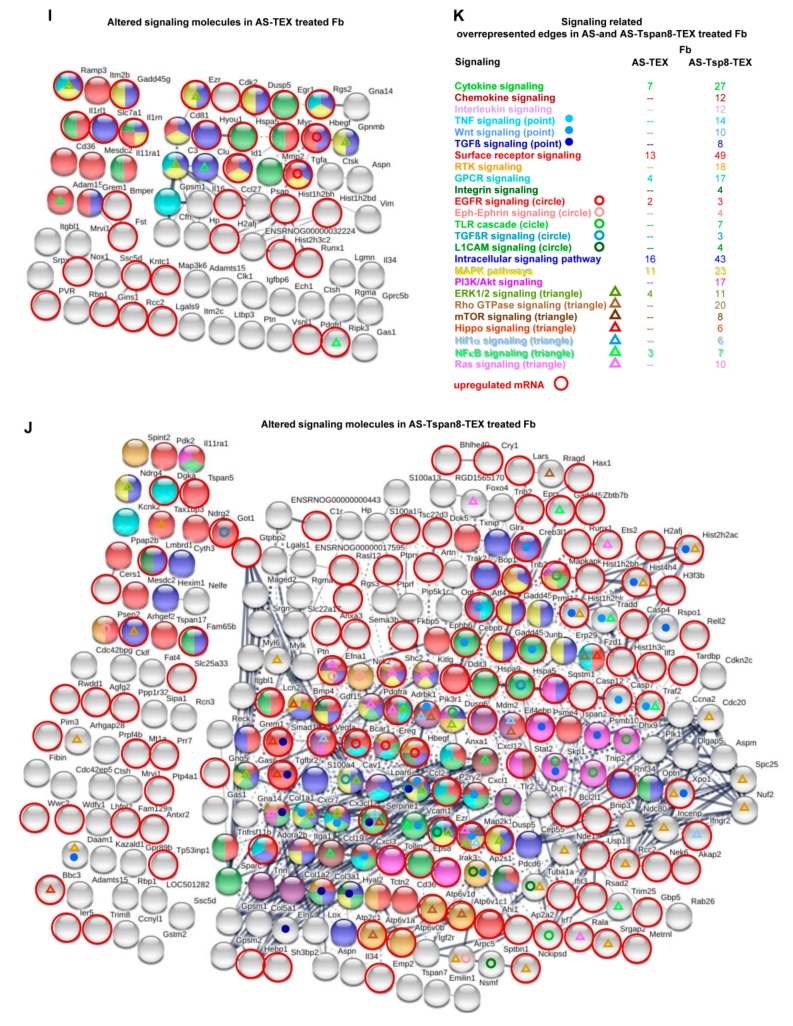
Figure 4.
Signaling pathway integration of mRNA up- or downregulated in TEX-treated fibroblasts. mRNA was evaluated in AS- and AS-Tspan8-TEX-treated Fb for up- or downregulation compared to untreated Fb. (A–D) STRING functional protein analysis included mRNA with a signal strength ≥1000 and ≥2-fold difference between untreated and TEX-treated Fb, only connected nodes being shown (A) mRNA upregulated in AS-TEX- and (B) AS-Tspan8-TEX-treated Fb; (C) engagement of overrepresented edges of upregulated mRNA in the regulation of biological processes; (D) engagement of overrepresented edges of downregulated mRNA (see Figure S5D) in the regulation of biological processes. (E) WB of indicated proteins in untreated, AS- and AS-Tspan8-TEX-treated Fb; (F) RTK and non-RTK protein array of Fb and AS-Tspan8-TEX-treated Fb. The mean of duplicates is shown, signal intensity being adjusted to 1 for untreated Fb. A significant increase in signal strength ≥1.5-fold is indicated by a grey * and by ≥2-fold by a black *; (G) Fb were seeded on top of matrigel-coated transwell plates that contained RPMI/10% FCS or RPMI/30µg/mL AS- or AS-Tspan8-TEX. After 48 h, cells at the lower membrane site were fixed and stained with crystal violet, light microscopy appearance (scale bar: 20 µm). (H) WB of the indicated proteins in Fb, AS- and AS-Tspan8-TEX-treated Fb; (I–K) STRING functional protein analysis for signaling engaged molecules up- or downregulated in (I) AS- and (J) AS-Tspan8-TEX-treated Fb, upregulated mRNA being indicated by a red circle; (K) overrepresented edges for signaling-related molecules and processes, the number of mRNA in overrepresented edges is shown. Full name of gene symbols: Table S10.


