Figure 6.
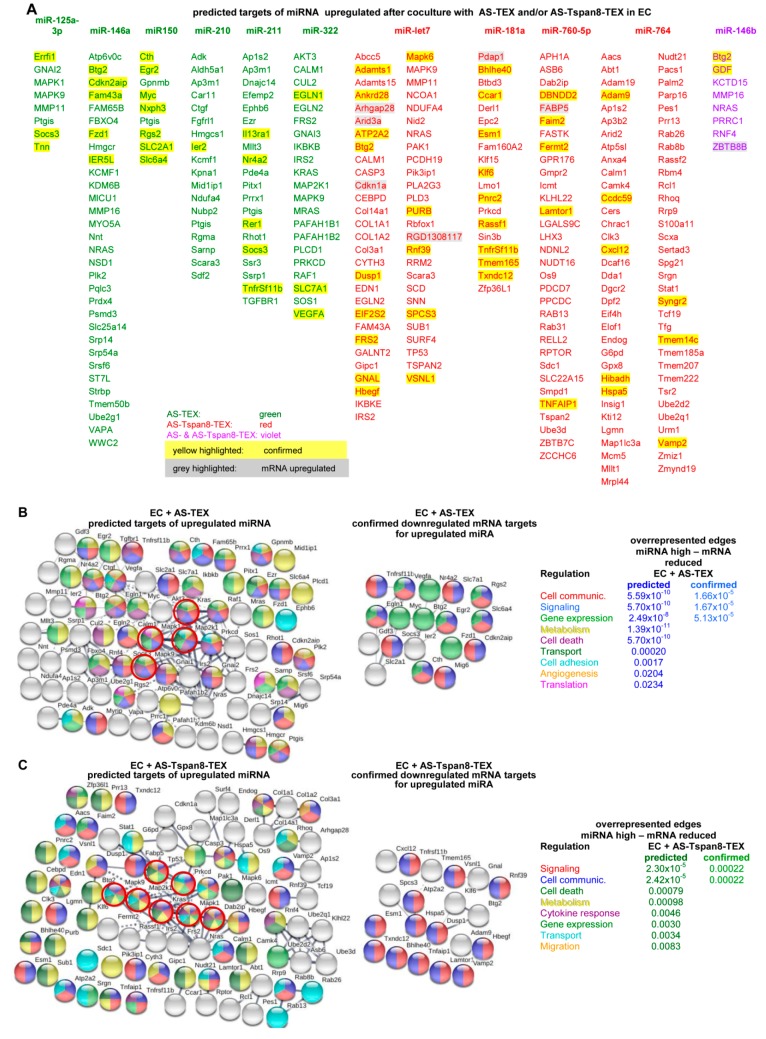
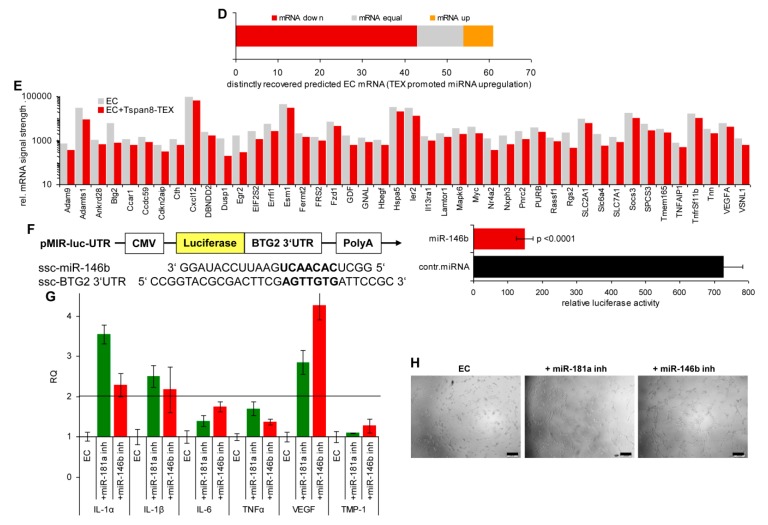
Connectivity of target mRNA of upregulated miRNA in TEX-treated endothelial cells. Predicted targets of miRNA upregulated after AS- or AS-Tspan8-TEX treatment were searched for by http://www.microrna.org and http://www.targetscan.org. (A) Predicted mRNA of miRNA expressed at a higher level in EC after coculture with TEX. The threshold level of mRNA was set to a signal strength of ≥500 and a ≥1.5-fold decrease; miRNA upregulated after AS-TEX treatment: green, after AS-Tspan8-TEX treatment: red, after AS- and AS-Tspan8-TEX treatment: violet; predicted mRNA reduction: highlighted yellow, predicted mRNA upregulation: highlighted grey. (B) Spring functional networks of predicted and confirmed downregulated mRNA corresponding to upregulated miRNA after AS-TEX treatment and some significantly overrepresented edges; (C) corresponding analysis to (B) for AS-Tspan8-TEX-promoted upregulated miRNA; (B,C) color of filled circles corresponds to the process of overrepresented edges; circles indicate strongly connected genes; unconnected nodes that were not engaged in the indicated processes were omitted. (D) Summary of mRNA recovery in AS-Tspan8-TEX-treated EC displaying increased miRNA levels and (E) list of downregulated mRNA; (F) Confirmation of BTG2 downregulation by miR-146b as revealed by a double luciferase assay. (G) Confirmation of miR-181a and miR-146b functional activity by culturing EC for 48 h with miR-181a or miR-146b inhibitors or a negative control inhibitor. RNA was isolated and evaluated by qRT-PCR for IL1α, IL1β, IL6, TNFα, VEGF, and TIMP1 expression; relative quantification (RQ) values±SD of triplicates, RQ value of EC cocultured with the negative control inhibitor being set as 1. A 2-fold increase was accepted as significant. (H) EC cultured with miRNA inhibitors as in (G) were seeded on matrigel-precoated plates and incubated with conditioned medium at 37 °C, 5% CO2 in air according to the supplier’s suggestion. Growth and tube formation was evaluated after 8h of culture by light microscopy (scale bar: 200 µm). Full name of gene symbols: Table S10.


