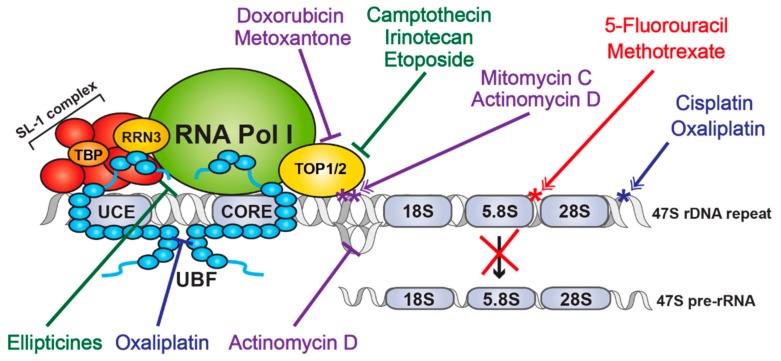
Figure 3.
Schematic representation of mechanisms of action of unspecific Pol I transcription inhibitors. Figure showing an overview of the effects of unspecific Pol I transcription inhibitors. Blue - Alkylating agents; Red—Antimetabolites; Green—Plant alkaloids; Purple—Antibiotics. *—DNA adducts (purple), Platinum adducts (blue) or DNA damage (red).

