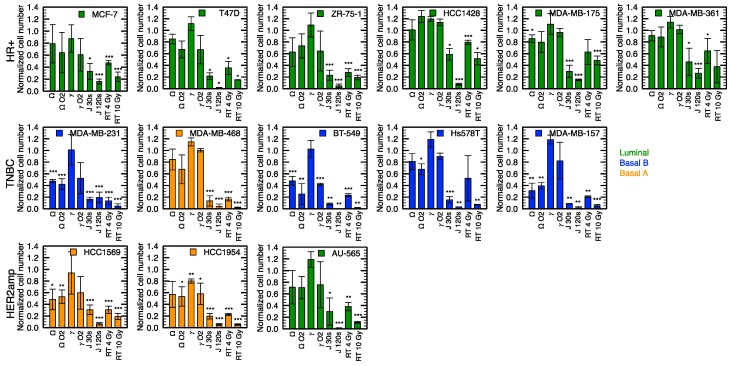
Figure 2.
Comparison of the efficiency of different treatments (see Table 2 for experimental conditions) on a panel of breast cancer cell lines using proliferation assays. Hormone receptor positive (HR+), Triple negative breast cancer (TNBC) and HER2 amplified (HER2amp) define the receptor status of cell lines and the color code refers to the molecular subtype. The Ω and γ modes (4 and 2 min) were compared with and without the injection of 2 mL min-1 of O2 in the high-voltage electrode. Two doses were compared for the jet mode (30 and 120 s) and for radiation therapy (4 and 10 Gy). Error bars represent the standard deviation over three independent experiments. * p < 0.05, ** p < 0.01, *** p < 0.001 with respect to the control.

