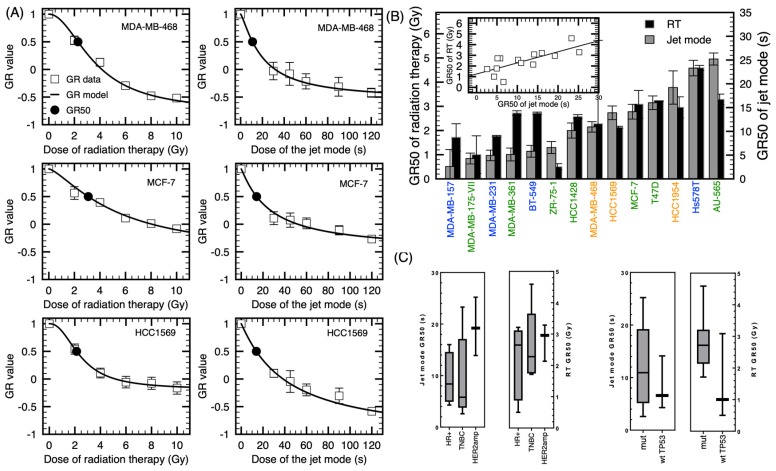
Figure 4.
Dose response and sensitivity of different cell lines to the jet mode and radiation therapy. (A) Dose-response curves with the theoretical curve obtained from a log-logic fit, with radiation on the left and plasma treatment on the right. Error bars represent the standard deviation over three independent experiments. (B) Calculated GR50 of radiation therapy and jet mode. Pearson’s correlation plot of the GR50 of the jet mode and GR50 of radiation therapy (p < 0.005). (C) Box-and-whisker plots of GR50 classified according to the receptor status and TP53 mutation.

