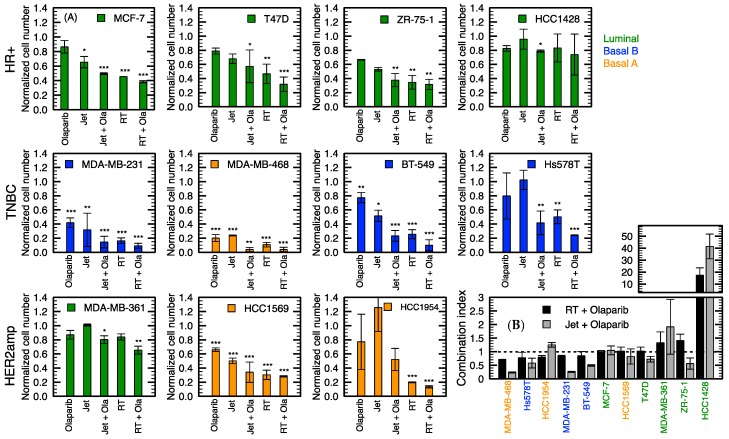
Figure 6.
Combination of the jet mode (10 s) with olaparib (2 μM) for a subpanel of cell lines. (A) Normalized cell numbers for different combinations of treatments. (B) Combination index (CI < 1: synergistic, CI = 1: additive, CI > 1: antagonist) of the jet mode (10 s) and radiation therapy (4 Gy) with olaparib (2 µM). Error bars represent the standard deviation over three independent experiments. * p < 0.05, ** p < 0.01, *** p < 0.001 with respect to the control.

