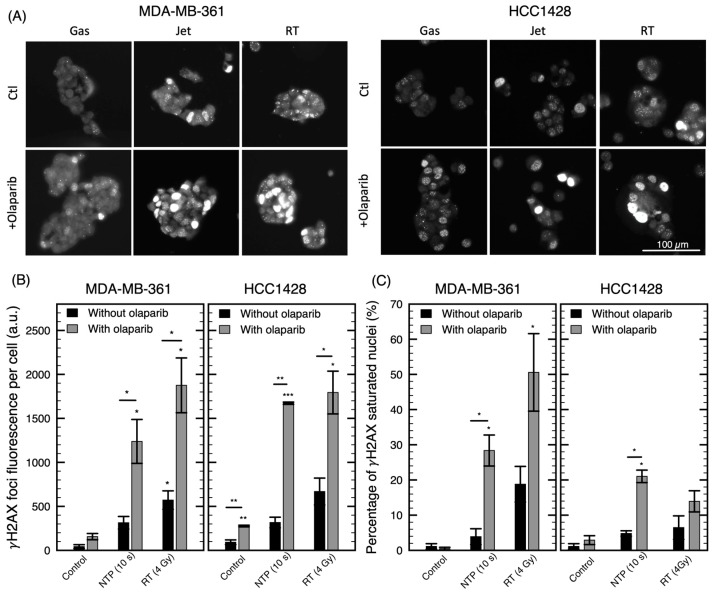
Figure 7.
Visualization of DNA damage for a combination of olaparib with NTP or RT treatments. Immunofluorescence of γH2AX foci 24 h after treatment with gas (10 s), jet (10 s), RT (4 Gy) alone or in combination with olaparib (2 µM). (A) Example pictures of γH2AX for MDA-MB-361 and HCC1428 cell lines. (B) Total fluorescence of γH2AX foci per cell (MDA-MB-361 and HCC1428). (C) Percentage of nuclei with fluorescence of γH2AX foci covering the complete nucleus. Error bars represent the standard deviation over two or three pictures containing an average of 30 nuclei. * p < 0.05, ** p < 0.01, *** p < 0.001 with respect to the control or the equivalent condition without olaparib.

