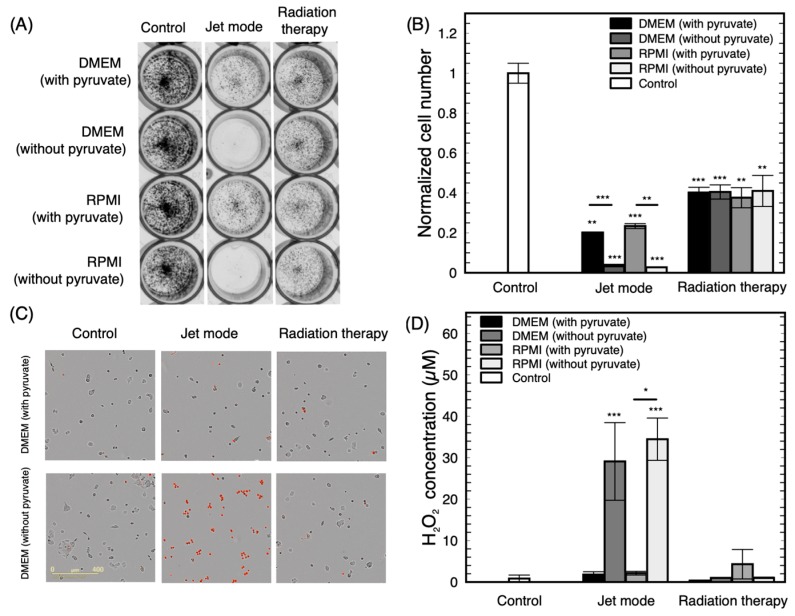
Figure A1.
Influence of the culture medium on plasma treatment efficacy for the T47D cell line. (A) Representative example of a proliferation assay following plasma treatment (30 s in jet mode) or radiation therapy (4 Gy). (B) Quantification of normalized cell numbers from proliferation assays (6 d). (C) Fluorescence microscopy after treatments showing dead cells in red (PI). (D) H2O2 concentration measured in the medium after plasma treatment or irradiation. For this figure, n = 3 over independent experiments. * p < 0.05, ** p < 0.01, *** p < 0.001 with respect to the control or other treatment.

