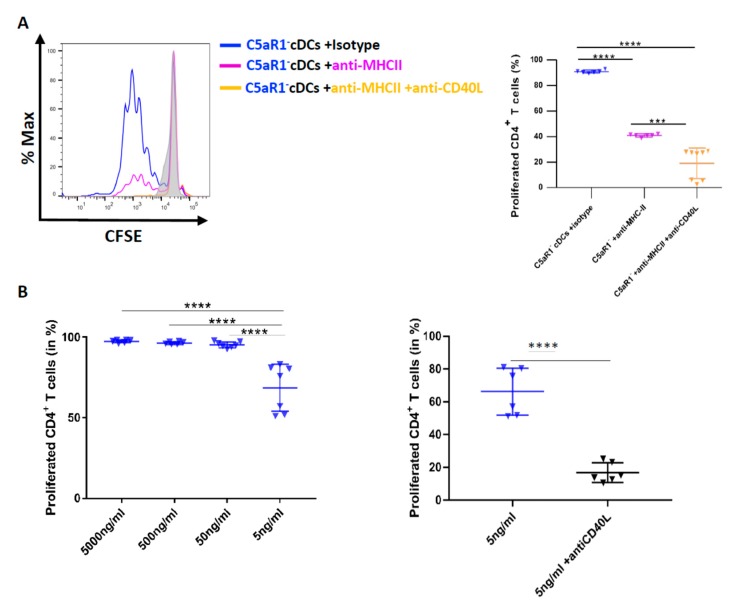
Figure 7.
The effect of MHC-II targeting on C5aR1− cDC-driven T cell proliferation in response to CD40L neutralization. (A) Histogram (left) showing the impact of MHC-II (10 pg/mL) blockade on T cell proliferation in C5aR1− cells in the presence or absence of CD40L blockade; the grey histogram shows the signal obtained from T cell directly after CFSE labeling. The graph on the right-hand side shows the quantitative evaluation of MHC-II ± CD40L blockade. Values shown are the mean ± SEM; n = 6–8 per group. Data were analyzed by ANOVA, followed by Tukey post-hoc test; * indicates significant differences between the treatment groups; *** p < 0.001 and **** p < 0.0001. (B) Impact of CD40L targeting on T cell proliferation when the antigen concentration is limited. WT mice were treated once with HDM (100 μg) i.t. C5aR1− cDCs from WT mice were FACS-purified from lung tissue 24 h after the treatment. C5aR1− cDCs were co-cultured with CFSE-labeled OVA-specific TCR tg CD4+ T cells in the presence of different concentrations of OVA323–339 peptide (5 μg/mL, 500 ng/mL, 50 ng/mL, 20 ng/mL and 5 ng/mL) and GM-CSF (20 ng/mL). Left panel: frequency of proliferated T cells in response to different concentrations of OVA323–339 peptide as mean ± SEM, n = 6–7. Data were analyzed by ANOVA, followed by Tukey post-hoc test; * indicates significant differences between the different treatment groups, **** p < 0.0001; right panel: impact of CD40L targeting on C5aR1− cDC-driven T cell proliferation in the presence of low OVA323–339 peptide concentration, n = 6–7. Data were analyzed by unpaired t test; * indicates significant differences between the two treatment groups; **** p < 0.0001.

