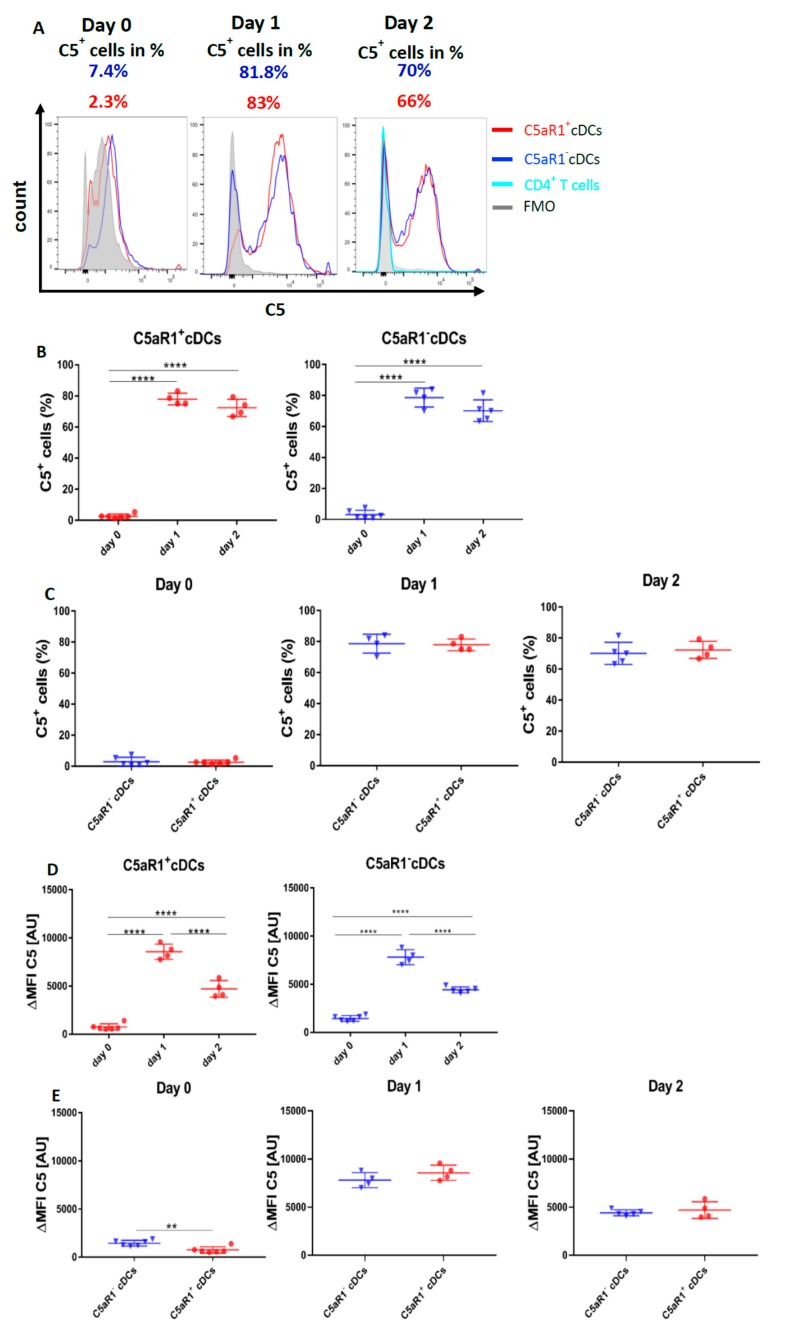
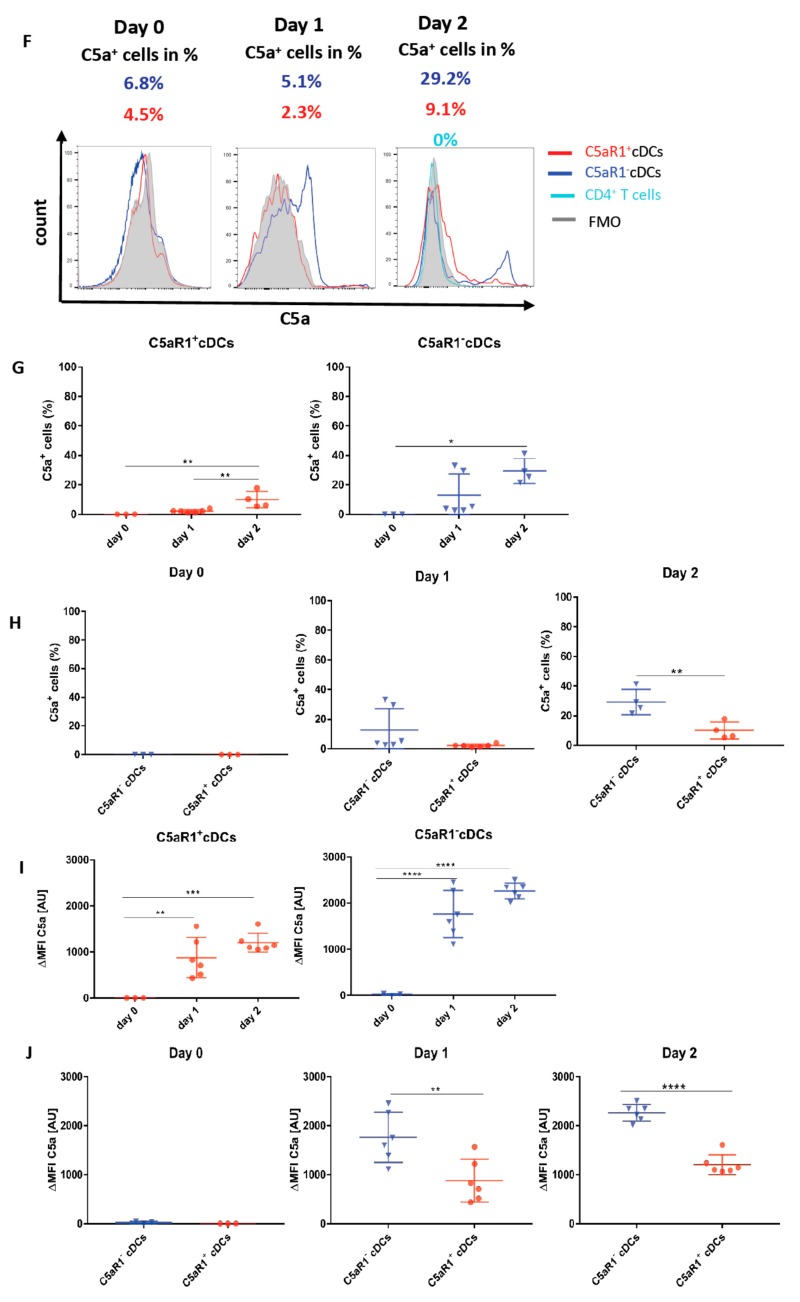
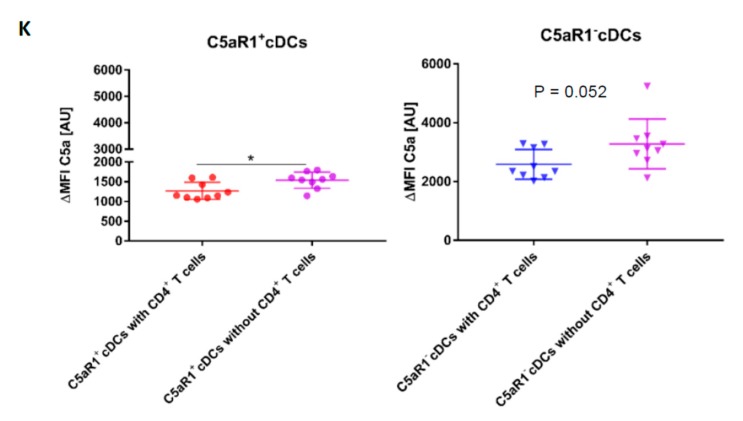
Figure 8.
Impact of OVA-pulsing and T cell co-culture on C5 production and C5a generation from C5aR1+ and C5aR1− cDCs. (A,F) Histograms showing C5 production (A) or C5a generation (F) in C5aR1+ or C5aR1− cDC subsets directly after FACS purification on day 0, after OVA-pulsing on day 1 or after addition of OVA-tg CD4+ T cells on day 2; grey histogram = FMO control. (B,G) Frequency of C5-producing (B) or C5a-generating (G) C5aR1+ (left panel) or C5aR1− cDCs (right panel). (C,H) Comparison of the frequencies of C5-producing (C) or C5a-generating (H) C5aR1+ and C5aR1− cDCs on days 0, 1 and 2. (D,I) Quantitative evaluation of C5 production (D) or C5a generation (I) in C5aR1+ (left panel) or C5aR1− (right panel) cDCs on days 0, 1 and 2. (E,J) Comparison of C5 production (E) or C5a-generation (J) in C5aR1− or C5aR1+ cDCs on days 0, 1 and 2. The data shown in D, E, I and J show the ΔMFI of C5 or C5a expression by the two cDC subsets; the ΔMFI is defined as the mean fluorescence intensity of the signal normalized to the FMO control. Data shown in B–E and G–J are the mean ± SEM, n = 4–6 per group; data in B, D, G and I were analyzed by ANOVA followed by Tukey’s post-hoc test; * indicates significant differences between C5aR1+ and C5aR1− cDCs on day 0 vs. days 1 and 2; ** p < 0.01, *** p < 0.001, **** p < 0.0001; data in C, E, H and J were compared by unpaired t-test; * indicates significant differences between C5aR1+ and C5aR1− cDCs on days 0, 1 or 2; ** p < 0.01, **** p < 0.0001. (K) Impact of T cells on OVA-driven C5a production C5aR1+ (left panel) or C5aR1− (right panel) cDCs from allergen-exposed mice. Shown is the intracellular expression of C5a in OVA-pulsed cDCs that were co-cultured with or without OVA-specific TCR tg CD4+ T cells as ΔMFI of C5a expression by the two cDC subsets. Data shown are the mean ± SEM. n = 9. They were analyzed by unpaired t-test. * p < 0.05.


