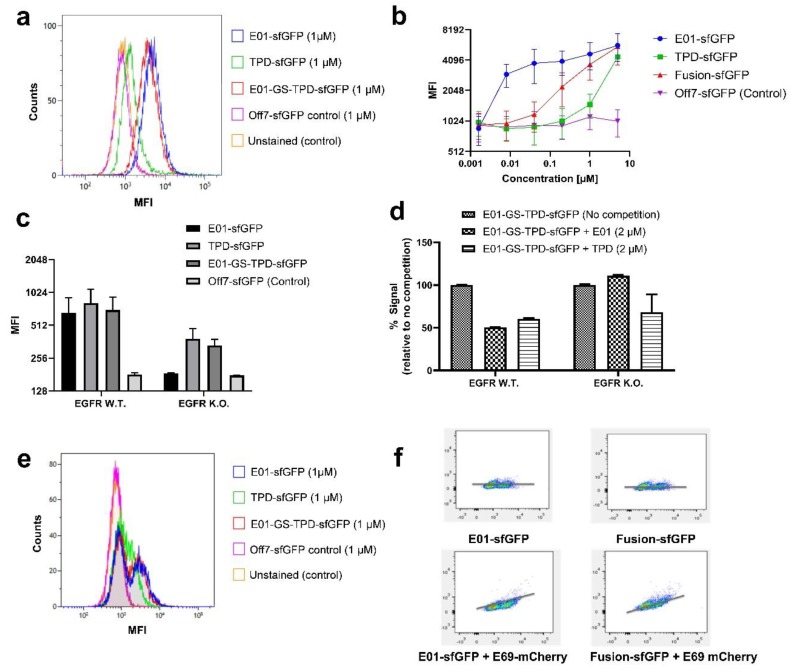
Figure 2.
Analytical flow cytometry assays reveal binding of fusion protein E01-GS-TPD. (a) overlay histogram of A549 EGFR (+/+) cells treated with the fluorescently tagged recombinant proteins used in this study (mean fluorescence intensities (MFI)). (b) binding curves upon incubation of A549 EGFR (+/+) cells with E01-sfGFP, TPD-sfGFP, fusion protein E01-GS-TPD-sfGFP, or negative control DARPin Off7-sfGFP. MFI, and their half-peak coefficient of variation (%CV) are shown for each concentration. (c) binding of each protein to A549 EGFR (+/+) or A549 EGFR (−/−) cells. (d) competition assays using A549 cells treated with fluorescently labeled fusion protein E01-GS-TPD-sfGFP in competition with unlabeled monomer (E01 or TPD); a decrease in fluorescence was observed in EGFR (+/+) cells; in contrast, no competition from unlabeled E01 for binding to EGFR was observed in EGFR (−/−) cells, while competition from unlabeled TPD remained unaffected. (e) overlay histogram of A549 co-cultures of EGFR (+/+) and (−/−) cells (1:1) treated with the fluorescently tagged recombinant proteins used in this study. Two peaks are observed in E01-sfGFP and fusion protein E01-GS-TPD-sfGFP, compared to one single peak in TPD-sfGFP and the negative control DARPin Off7. (f) correlation plots for co-cultures stained with E01-sfGFP or fusion protein E01-GS-TPD-sfGFP, in the presence or absence of the anti-EGFR DARPin E69 fused to monomeric Cherry (mCherry). The x-axis corresponds to GFP fluorescence intensity, while the y-axis shows mCherry fluorescence intensity.

