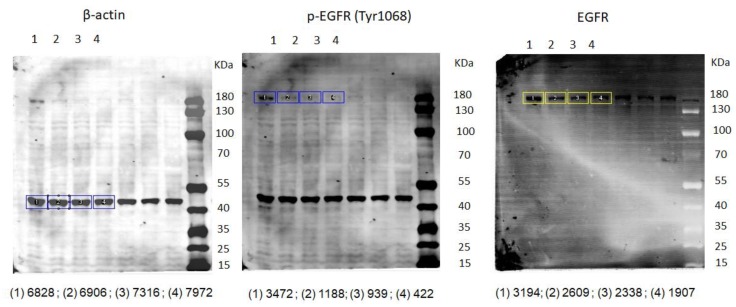
Figure A3.
Western blot and densitometry analysis of A431 cells treated with E01-GS-TPD. Western blot pictures from Figure 3a are shown. The densitometry analysis for each sample is shown below each blot (1) untreated 0 µM, (2) E01-GS-TPD 0.1 µM, (3) E01-GS-TPD 0.5 µM, and (4) E01-GS-TPD 1 µM.

