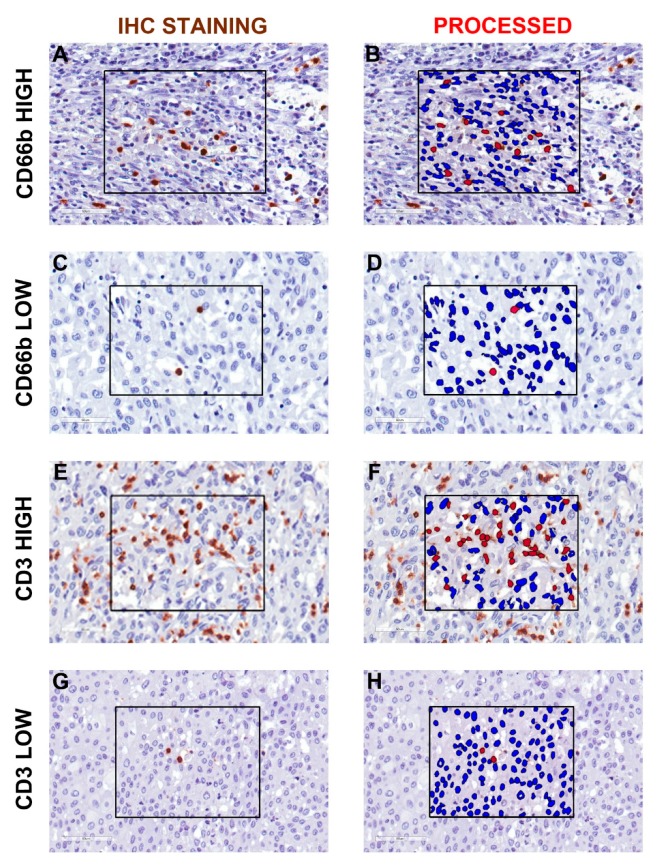
Figure 1.
Representative image analysis for CD66b+ TAN and CD3+ T cells in human MIBC. Sections are from four representative human MIBC (case #66, #31, #7 and #46) and stained as labeled and counterstained with hematoxylin (A,C,E,G). On the right column, the corresponding processed area is shown (B,D,F,H). Case with high and low density of CD66b+ TAN (A and C, respectively) and CD3+ T cells (E and G, respectively) are displayed. Images acquired from digital slides using 400× magnification have been digitally resized using Adobe Photoshop.

