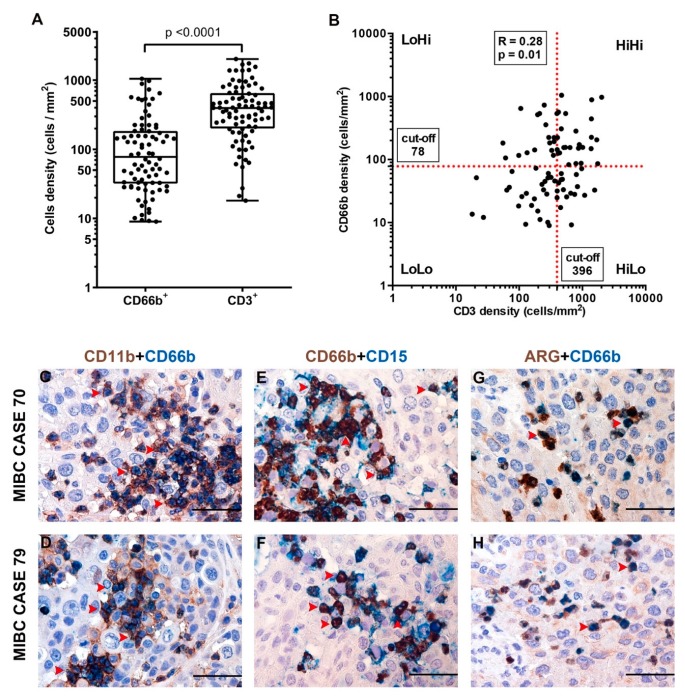
Figure 2.
Density of CD66b+ TAN and CD3+ T cells and phenotype of TAN in human MIBC. Dot plots indicating the density of CD66b+ TAN and CD3+ T cells in the MIBC cohort is reported in (A); the correlation between the two variables is illustrated in (B). Sections are from two representative MIBC cases (case #70 in C, E and G; case #79 in D, F and H) and stained as labeled, illustrating CD66b+ TAN co-expressing neutrophil markers: CD11b, CD15 and ARG. Sections are counterstained with hematoxylin. Magnification 400× (scale bar 50 micron).

