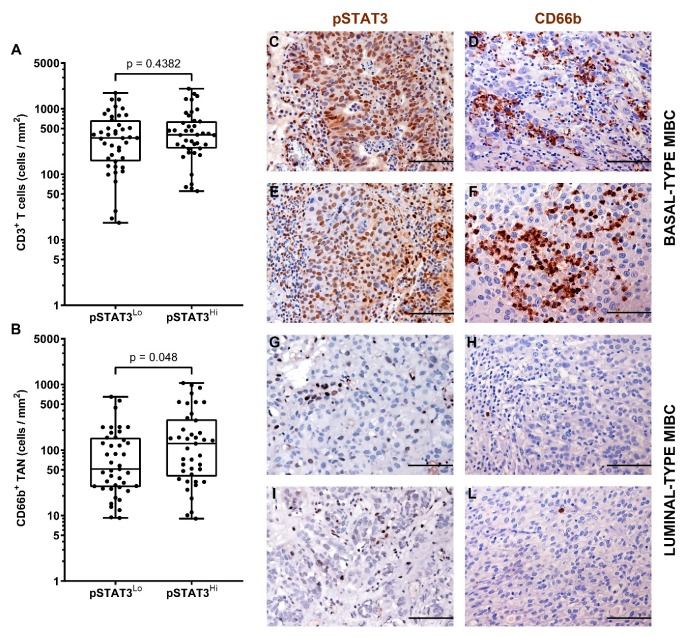
Figure 6.
Density of CD66b+ TAN and CD3+ T cells in human MIBC with hyper-activation of STAT3. Dot plots indicating the density of CD3+ T cells (A) and CD66b+ TAN(B) in the MIBC cohort based on pSTAT3 expression. Sections are from two pSTAT3 HIGH (case 49 and 2, in C–F) and two pSTAT3 LOW (case 68 and 57, in G–L) MIBC cases and stained as labeled and counterstained with hematoxylin. Magnification: 200× (C–L), scale bar 100 micron. p values were estimated by Kruskal-Wallis test.

