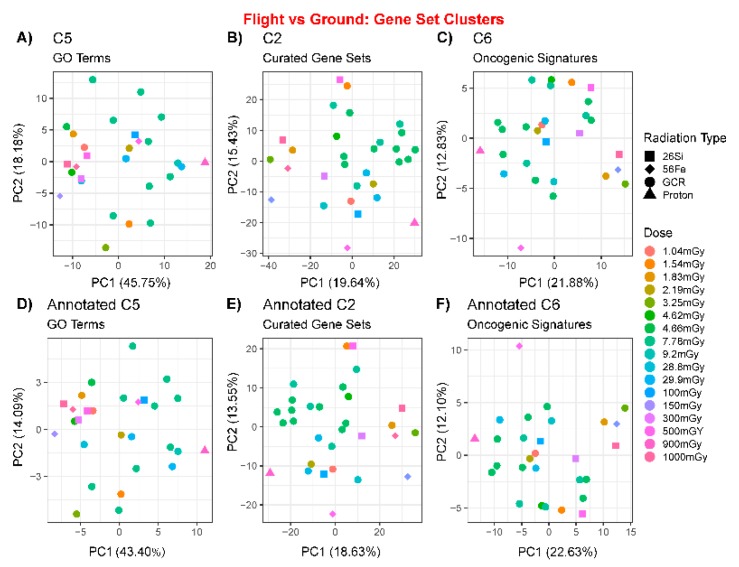
Figure 3.
Principal component analysis (PCA) plots on GLDS datasets using the gene set enrichment analysis (GSEA) nominal enrichment scores before (top row) and after (bottom row) auto-annotation using Cytoscape’s enrichment map software. GSEA gene sets used were as follows: (A,B) C5 Gene Ontology (GO) terms, (C,D) C2 curated terms, and (E,F) C6 oncogenic signature terms. Each data point is represented by experimental radiation dose (color) or radiation type (shape).

