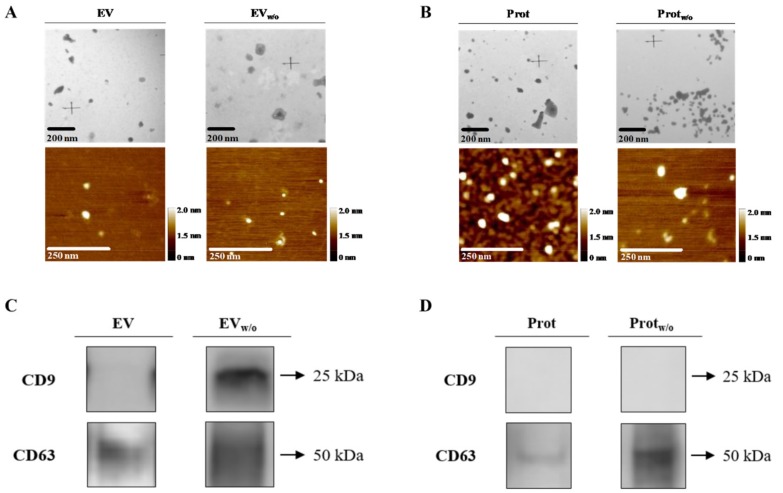
Figure 2.
EV, EVw/o, Prot and Protw/o isolates characterization by TEM, AFM and western blot. (A,B) Representative TEM and AFM images for each group of EVs or pooled protein fractions with their respective scale bars. (C,D) Typical EV markers (CD9 and CD63) identified by western blot from EV, EVw/o samples or Prot and Protw/o, loading the same amount of protein for both group samples.

