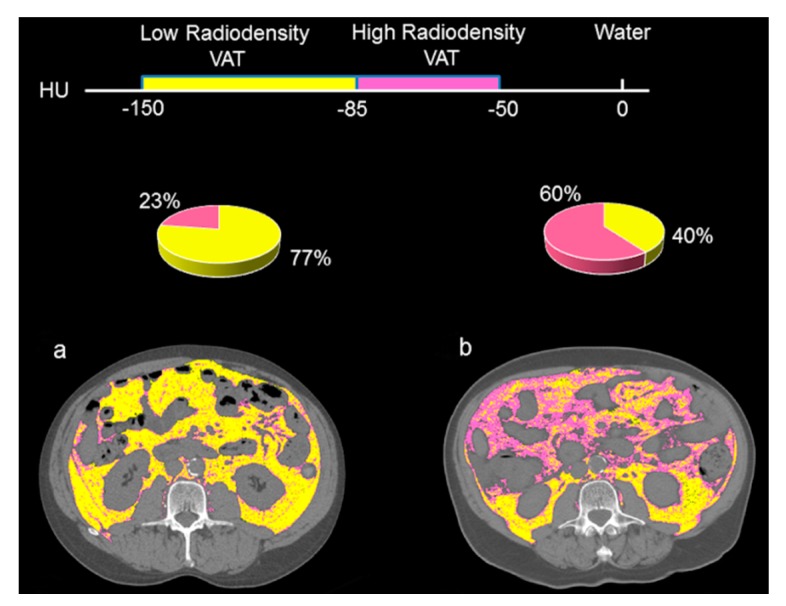
Figure 2.
Abdominal CT images taken at the 3rd. lumbar vertebra of patients with high versus low visceral adipose tissue radiodensity. Comparison of two HCC patients with the same visceral adipose tissue index (a) with a low visceral adipose tissue (VAT) radiodensity (−98 HU) and (b) with a high VAT radiodensity (−80 HU). Visceral adipose tissue with high radiodensity (−50 to −85) is shown in pink and low radiodensity VAT (−86 to −150) is shown in yellow. More than 75% of the total VAT area in Figure 2a represents the area composed of low-radiodensity VAT, whereas for Figure 2b the areas of high-radiodensity VAT is predominant (60%).

