Figure 5.
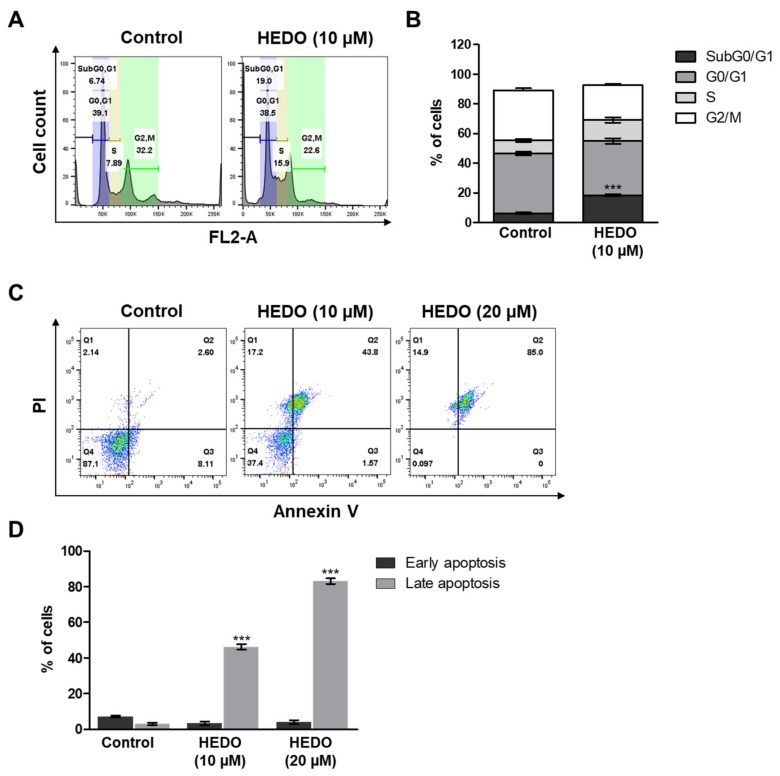
Altered cell cycle progression and apoptosis of OCI-LY3 cells due to HEDO (10 μM). (A) Percentage of cells in the subG0/G1, G0/G1, S, and G2/M phases after treatment with each compound. Cells were analyzed through flow cytometry. (B) Cell cycle analysis of cells from the same three experiments. *** p < 0.001 versus control group. (C) OCI-LY3 cells were either treated with HEDO or untreated for 72 h and apoptosis was subsequently evaluated through flow cytometry. (D) Quantification of apoptotic cells. Values indicate the means ± SEM. (n = 3, *** p ≤ 0.001).

