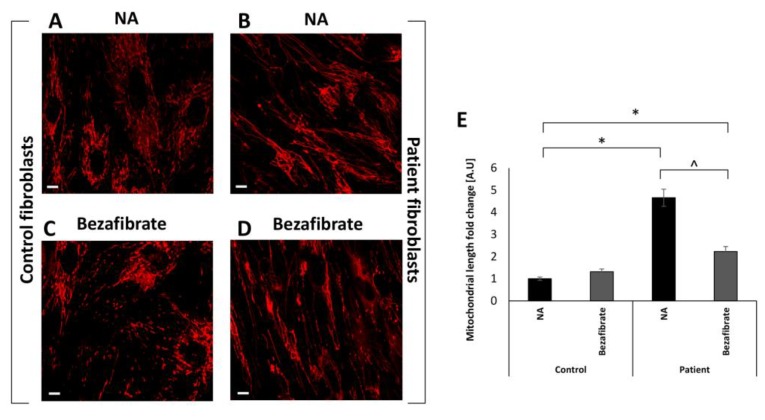
Figure 2.
Mitochondrial morphology. Control (A,C) and the patient’s fibroblasts (B,D) were seeded in 35 mm glass-bottom tissue culture plates. The following day, the medium was replaced with fresh high-glucose medium without (A,B) additive (NA) or in the presence of bezafibrate (C,D) and incubated for 72 h. Mitochondrial morphology was visualized by MitoTracker Red CM-H2XRos. Relative mitochondrial length was calculated and depicted (E) using ImageJ software. Mean normalized to control no additive ± SEM; * p < 0.05 compared to NA control; ^ p < 0.05 compared to same cell with no additive. Scale bar = 10 µM.

