Figure 1.
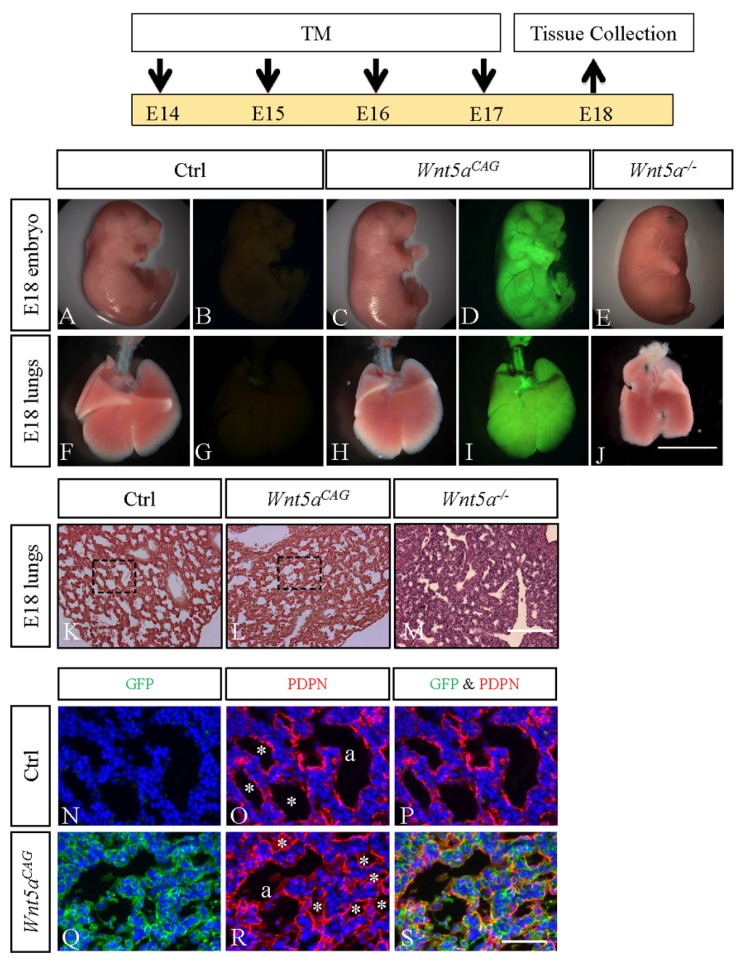
Wnt5a inactivation attenuated saccular stage lung development. Top: Schematic of the experimental plan. A–E: Gross morphology of E18 control (A and B), Wnt5aCAG (C and D) and Wnt5a-/- (E) embryos. Panels A, C and E show the bright-field images. Panels B and D show the green fluorescent images of control and Wnt5aCAG embryos, respectively. F–J: Gross morphology of E18 control (F and G), Wnt5aCAG (H and I) and Wnt5a-/- (J) lungs. Panels F, H and J show the bright-field images. Panels G and I show the green fluorescent images of control and Wnt5aCAG lungs, respectively. Scale bars (J): 10 mm for A–E, 4 mm for F–J. K–M: H&E staining of E18 control (K), Wnt5aCAG (L) and Wnt5a-/- (M) lungs. Scale bar (M): 200 μm for K–M. N–S: Immunostaining of GFP (green) and PDPN (red) in E18 control (N–P) and Wnt5aCAG (Q–S) lungs. Panels N–P and Q–S correlate to the boxed areas in Panels K and L, respectively. Asterisk indicates saccules. “a” indicates the junction between bronchiole and saccules. Scale bars (S): 50 μm for N–S.

