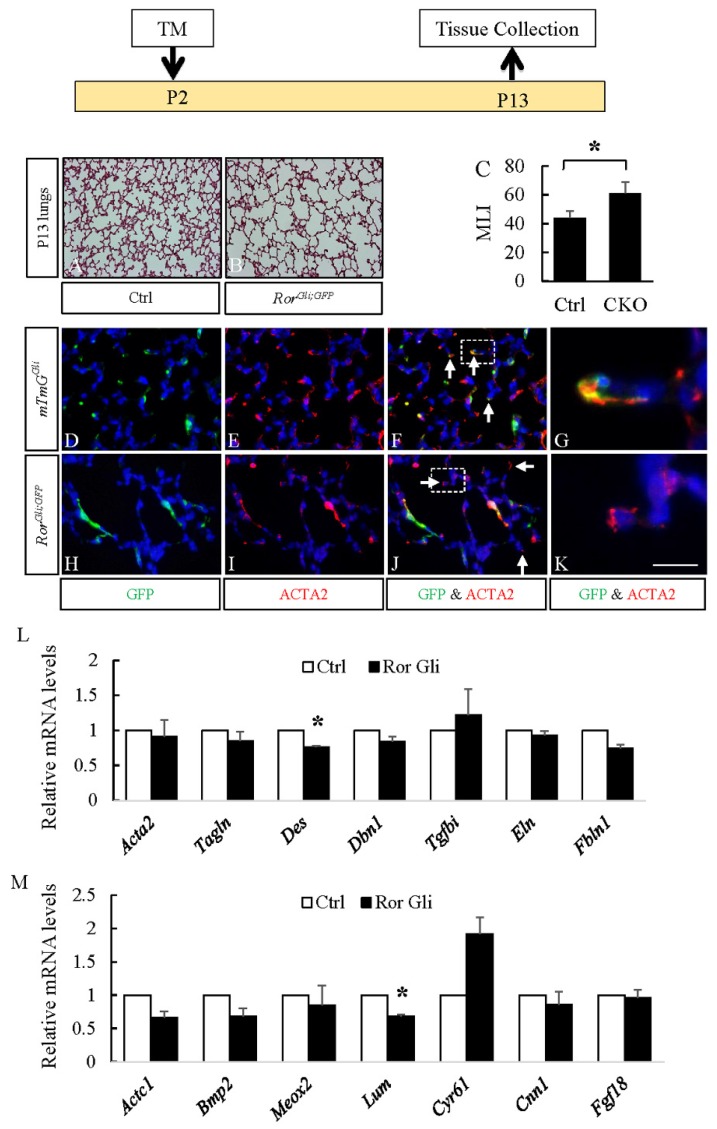
Figure 7.
Postnatal inactivation of Ror1 and Ror2 attenuated alveologenesis. Top: Schematic of the experimental plan. A–B: H&E staining of P13 control (A) and RorGli;GFP (B) lungs. C: Mean linear intercept (MLI) of P13 control and RorGli;GFP (CKO) lungs. D–K: Immunostaining of GFP (green) and ACTA2 (red) in P13 mTmGGli (D–G, control) and RorGli;GFP (H–K) lungs. Panels G and K show higher magnification views of boxed areas in F and J, respectively. Nuclei are counterstained with DAPI. Scale bars (K): 200 μm for A and B, 50 μm for D–F and H–J, 11 μm for G and K. L–M: Relative mRNA for myofibroblast enriched genes and cell migration genes in P13 RorGli;GFP (Ror Gli) lungs compared to control lungs by real-time RT-PCR analysis. Data represent the mean ± SEM. * indicates p < 0.05. n = 3.

