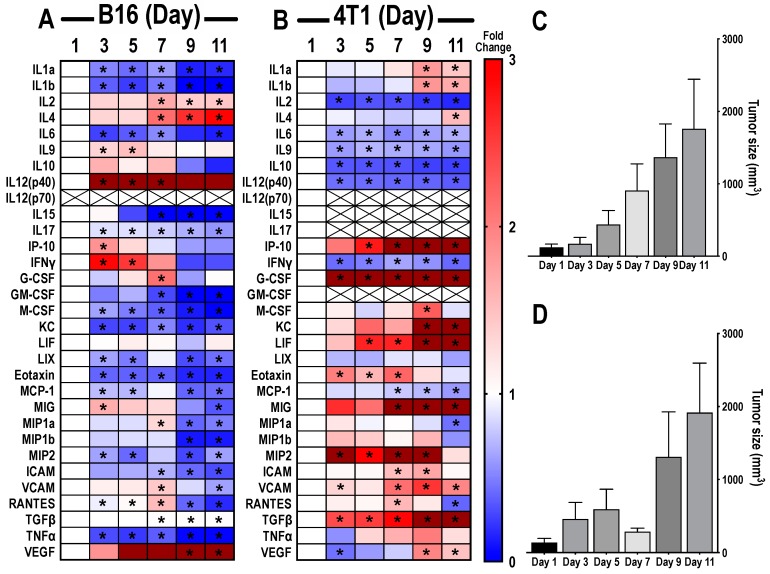
Figure 1.
Proteomic changes of cytokines, chemokines, and trophic factors (CCTFs) over time in tumor microenvironment (TME) of mouse xenograft B16 melanoma (A) or 4T1 breast cancer (B). Heat maps depict the calculated ratio between the mean concentration of the detected CCTFs in each time point to the average concentration detected on day 1. Blue represents fold changes less than 1. Red represents 1–3 fold changes. Dark red represents fold changes >3.1. Asterisks indicate statistical significance (p < 0.05) identified by one-way analysis of variance (ANOVA) test; tumor size volumes of mouse xenograft B16 melanoma (C) or 4T1 breast cancer (D) models were determined 3, 5, 7, 9, and 11 days after reaching ~5 mm size in diameter (day 1 tumors).

