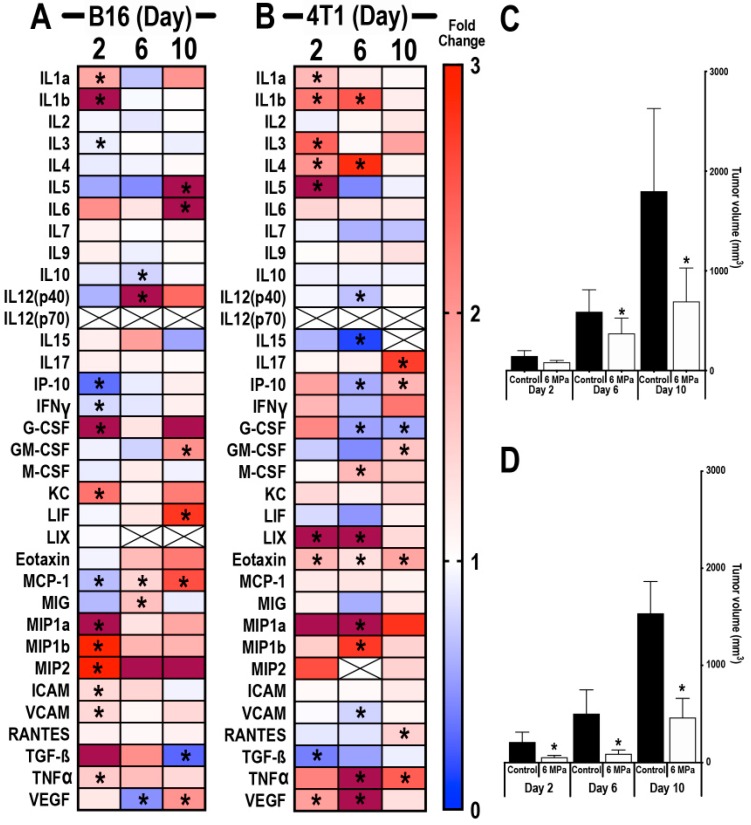
Figure 2.
Proteomic response of B16 or 4T1 tumors following pulsed focused ultrasound (pFUS) treatment on different growth progressions. Heat map depicting fold changes in CCTFs 24 h post-sonication of mouse B16 (A) or 4T1 (B) tumors on days 2, 6, or 10. Tumors from non-sonicated control mice on days 2, 6, and 10 served as time-matched controls. Protein levels are presented as fold changes in relation to time-matched non-sonicated control values. Blue represents fold changes less than 1. Red represents 1–3 fold changes. Dark red represents fold changes >3.1. Tumor size volumes of mouse xenograft B16 melanoma (C) or 4T1 breast cancer (D) model; asterisks indicate statistical significance (p < 0.05) identified by ANOVA test.

