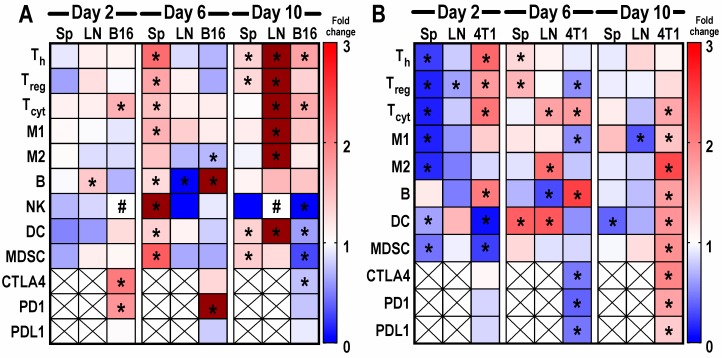
Figure 3.
Heat maps depicting fold changes of immune cell profiles and checkpoint receptor/ligands from mice with B16 melanoma (A) or 4T1 breast (B) tumor, spleen (Sp), and lymph node (LN) that were harvested 24 h following pFUS treatment on days 1, 5, or 9. Day 1 tumors were ~5 mm in size. Non-sonicated tumors harvested on day 2, 6, or 10 served as time-matched controls. Flow cytometry analysis was performed by staining fresh fixed immune cells (CD8+ Tcyt, CD4+ Th, Treg, natural killer (NK) cells, dendritic cells (DCs), F4/80 macrophages (M1 and M2), myeloid suppressive cells along with cytotoxic T-lymphocyte associated protein 4 (CTLA4), programmed cell death protein 1 (PD1), and programmed death ligand 1 (PDL1)) in the tumors. Blue represents fold changes less than 1. Red represents 1–3 fold changes. Dark red represents fold changes higher than 3. Asterisks indicate statistical significance (p < 0.05) identified by ANOVA test. Pound indicates undetected values.

