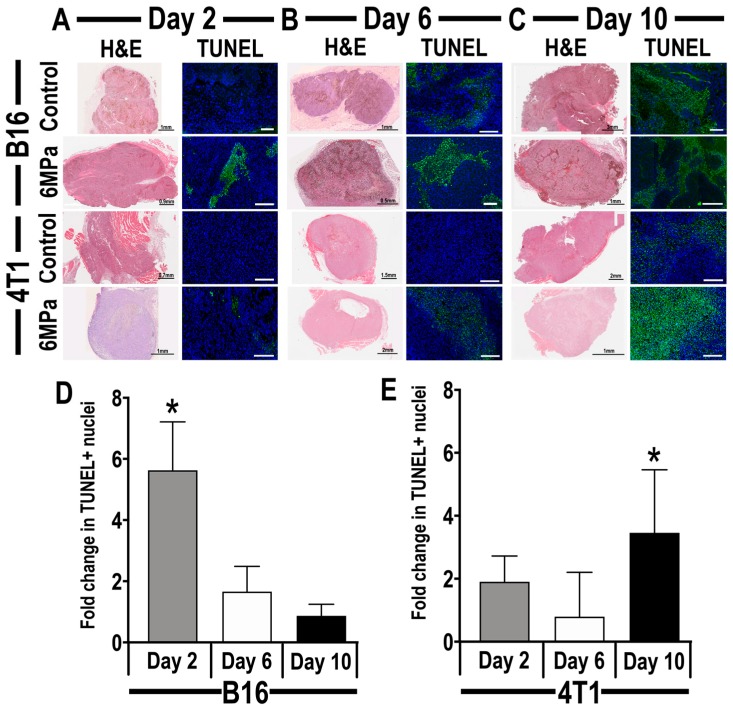
Figure 4.
Representative histological sections from mouse xenograft B16 melanoma tumor (upper panel) or 4T1 breast cancer (lower panel), 24 h following treatment with 6 MPa pFUS on days 2 (A), 6 (B), or 10 (C). (A–C) left: Representative hematoxylin and eosin (H and E)-stained; (A–C) right: DNA-damaged cells (green) in mouse xenograft tumor models (scale 200 µm); quantitative analysis of time-related changes in the number of DNA-damaged cells per field of view on B16 (D) or 4T1 (E) tumors, 24 h following pFUS treatment. Asterisks indicate statistical significance (p < 0.05) identified by ANOVA test.

