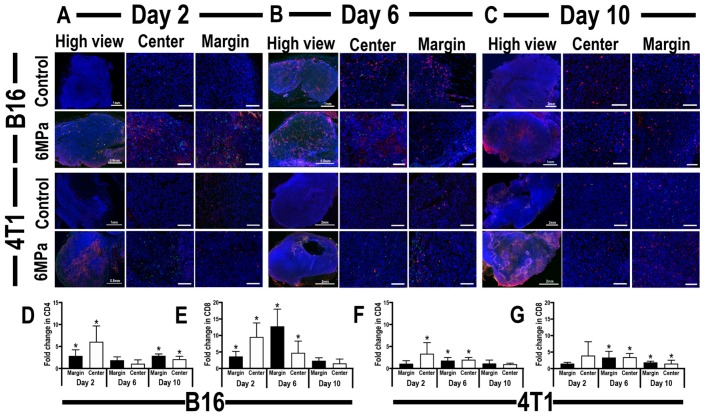
Figure 5.
Representative immunohistochemistry staining of CD4 (green), CD8 (red), and DAPI (blue) in tumor sections of mouse xenograft B16 melanoma tumor model (upper panel) or 4T1 breast cancer model (lower panel), after reaching 5 mm in diameter, 24 h post-pFUS (second and fourth rows) or untreated tumors (first and third rows). High-view image of B16 or 4T1 tumors on day 2 (A, left), day 6 (B, left), or day 10 (C, left); scale 100 µm. Lower view of center tumor areas in B16 or 4T1 tumors on day 2 (A, middle), day 6 (B, middle), or day 10 (C, middle); scale 100 µm. Lower view of tumor periphery areas in B16 or 4T1 tumors on day 2 (A, right), day 6 (B, right), or day 10 (C, right); scale 100 µm. Quantitative analysis of time-related changes in CD4+ (D) or CD8+ (E) cell localization within center or margin areas of B16 tumors. Quantitative analysis of time-related changes in positive CD4+ (F) or CD8+ (G) cell localization within center or margin areas of 4T1 tumors. Asterisks indicate statistically significant elevations (p < 0.05; ANOVA) between the pFUS-treated group to a time-matched untreated control.

