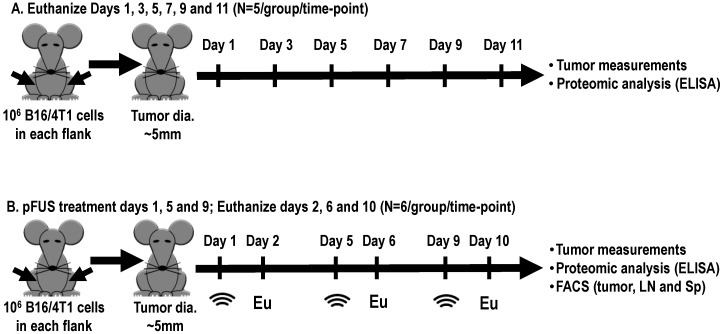
Figure 6.
Schematic diagram of the experimental setups. The starting point for all experiments was defined once tumor sizes reached ~5 mm in diameter. (A) Natural history growth of xenograft B16 or 4T1 tumors, harvested every other day without treatment for molecular analysis. (B) Tumors were treated with 6 MPa pFUS on days 1, 5, or 9, and tumors, spleens (Sp), or regional lymph nodes (LNs) were harvested 24 h for molecular, flow cytometry (FACS), and histology; pFUS: Pulse focus ultrasound; Eu: Euthanize.

