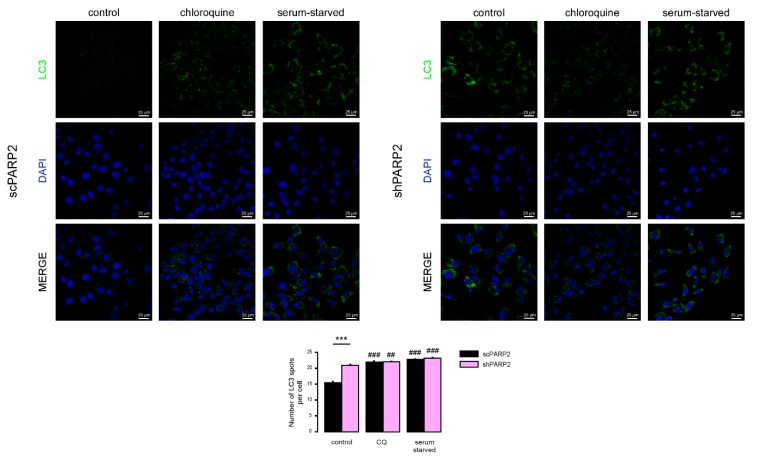
Figure 5.
Chloroquine and serum starvation induce LC3 expression in scPARP2 and shPARP2 cells to the same extent. scPARP2 and shPARP2 C2C12 cells were treated with 25 µM chloroquine for 2 h or serum-starved for 12 h. LC3 expression was assessed in confocal microscopy experiments. Alexa Fluor 488-linked LC3 specific antibody was used and the nuclei were visualized using DAPI, vesicles were counted. Representative images are presented on the figure. ## and ### represent statistically significant differences between the control and chloroquine-treated or control and serum-starved cells at p < 0.01 or p < 0.001, respectively. *** represent statistically significant differences between the scPARP2 and shPARP2 cells at p < 0.001. For the determination of statistical significance ANOVA test was used followed by Tukey’s post hoc test.

